Skip to content

Loretta C. Duckworth Scholars Studio

⠀

Menu
  • Scholars Studio Blog
    • Digital Methods
      • coding
      • critical making
      • data visualization
      • digital pedagogy
      • immersive technology (AR/VR)
      • mapping
      • textual analysis
      • web scraping
    • Disciplinary Fields
      • Anthropology
      • Archaeology
      • Architecture
      • Art History
      • Business
      • Computer Science
      • Critical Digital Studies
      • Cultural Studies
      • Dance
      • Economics
      • Education
      • Environmental Studies
      • Film Studies
      • Gaming Studies
      • Geography
      • History
      • Information Science
      • Linguistics
      • Literary Studies
      • Marketing
      • Media and Communication Studies
      • Music Studies
      • Political Science
      • Psychology
      • Public Health
      • Sculpture
      • Sociology
      • Urban Studies
      • Visual Art
    • Cultural Analytics Practicum Blogposts
  • Current Staff
  • Newsletter
  • About
    • Games Group 
Menu

The Architectural Visibility of St. Magnus Cathedral with GIS Viewshed Analysis (Part I)

Posted on February 14, 2017April 22, 2020 by

By Jennifer Grayburn

Cross-posted on my personal blog. 

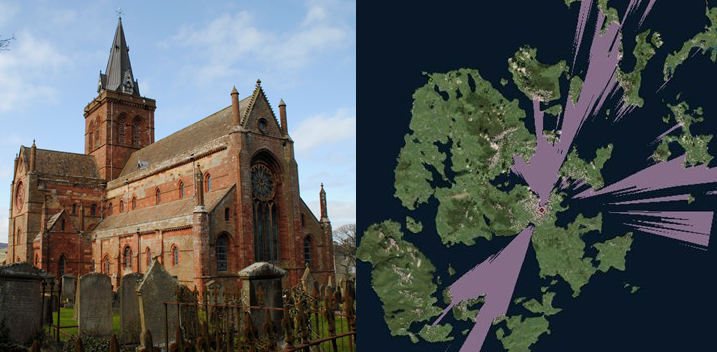
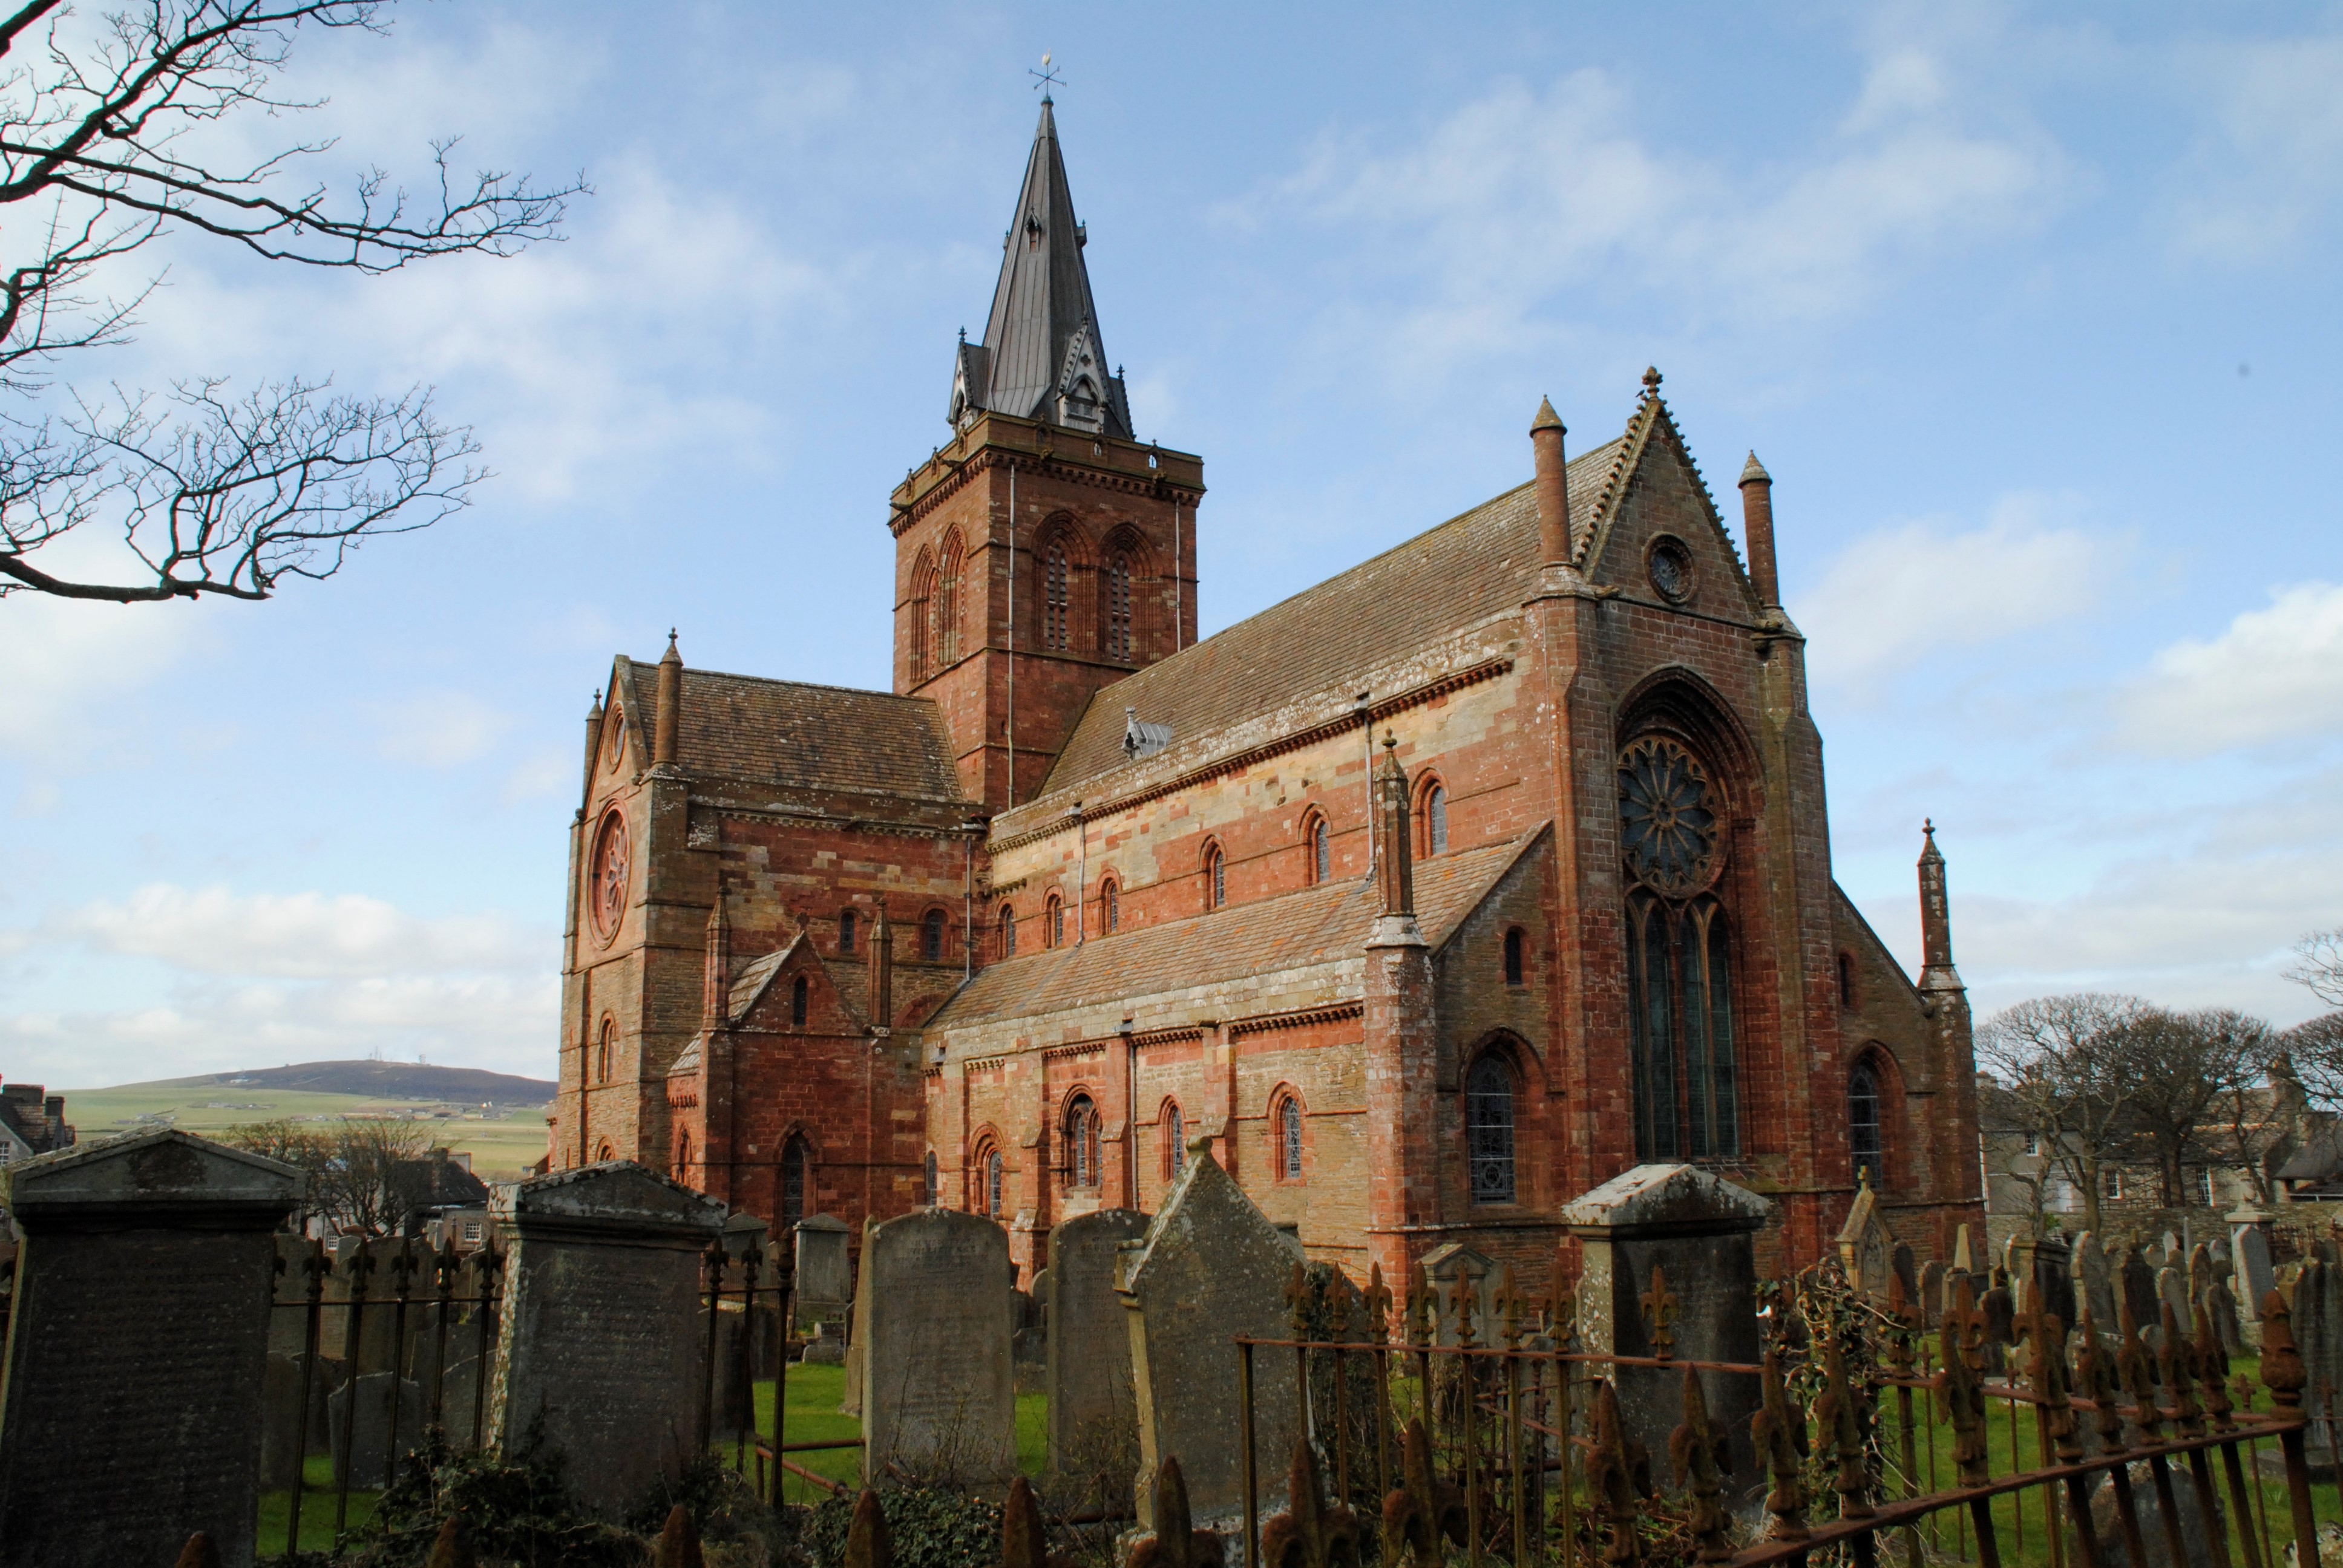
In architectural history and archaeology, geographic information system (GIS) programs are useful for mapping sites, geo-referencing plans, and analyzing data. Inspired by the work of Edward Triplett,  I used ArcGIS to map the viewshed for St. Magnus Cathedral (c. 1137). Viewshed is the area that is visible to a person or agent from a plotted point, and the resultant data shows what is (or would have been) visible from a given location. Visibility and inter-visibility between sites are important themes in landscape and architecture studies, especially as they pertain to spatial orientation and organization, territory and resource control, and symbolic and physical relationships. Combined with architectural and literary information, viewshed analysis offers a way to reevaluate and even hypothesize historical landscapes. The application and theory of viewshed have been developed for decades, especially in archaeology, and has been explored extensively elsewhere; the point of this two part blog is to 1) outline how I generated my viewshed and 2) discuss how it informed my research on St. Magnus Cathedral and the medieval landscape of Orkney, Scotland.

St. Magnus Cathedral, c. 1137

Viewshed analysis should be the start of critical inquiry, an additional piece of evidence to study rather than an end in itself. The accuracy of viewshed analysis can be limited by the quality of data provided by the digital elevation model (DEM) and personal measurements used, and the resultant data does not take into account possible obstacles that can inhibit views, including trees, human-built constructions, and atmospheric conditions. The Orkney Islands—where St. Magnus Cathedral is located—offers its own unique disadvantages and advantages for viewshed analysis. On one hand, Orkney’s weather and atmospheric conditions are rarely clear, and coastal erosion/reclamation efforts have undoubtedly changed the islands over the past 1000 years. On the other hand, the islands lack forest cover, and the many surviving ruins in the landscape from Neolithic to modern age suggest little alteration to the interior of the islands. The software does not recognize the analysis as a subjective point of view within a three-dimensional landscape. Rather, it uses an algorithm and elevation data in the DEM cells to determine which other cells/elevation heights would and would not be visible from a particular place and height. It is therefore important that you understand the landscape, your sources, and what the viewshed analysis can and can’t tell you when working with this data. I began experimenting with viewshed analysis before I had the chance to travel to Orkney myself, and my initial research question was open ended: what is visible to a person standing on the crossing tower of St. Magnus Cathedral?

Viewshed analysis of St. Magnus Cathedral, which is located near the center and marked with a small red dot.

My DEM files derive from Advanced Spaceborne Emission and Reflection Radiometer (ASTER) and are divided into pixels of raster data representing elevation. The data for Orkney was particularly problematic because it was spread across four separate data grids. With the help of a GIS specialist, I was able to download these four separate grids and mosaic them into one layer to ensure an accurate viewshed. Next, I used a satellite basemap to find the location of St. Magnus Cathedral’s crossing tower and added a second layer consisting of a single point over it. This point determines the point and elevation data used for the viewshed. Without any adjustment, however, the point will generate a viewshed at ground level. To account for the height of the tower, I changed the point’s Offset A attribute to the approximate height of the tower.

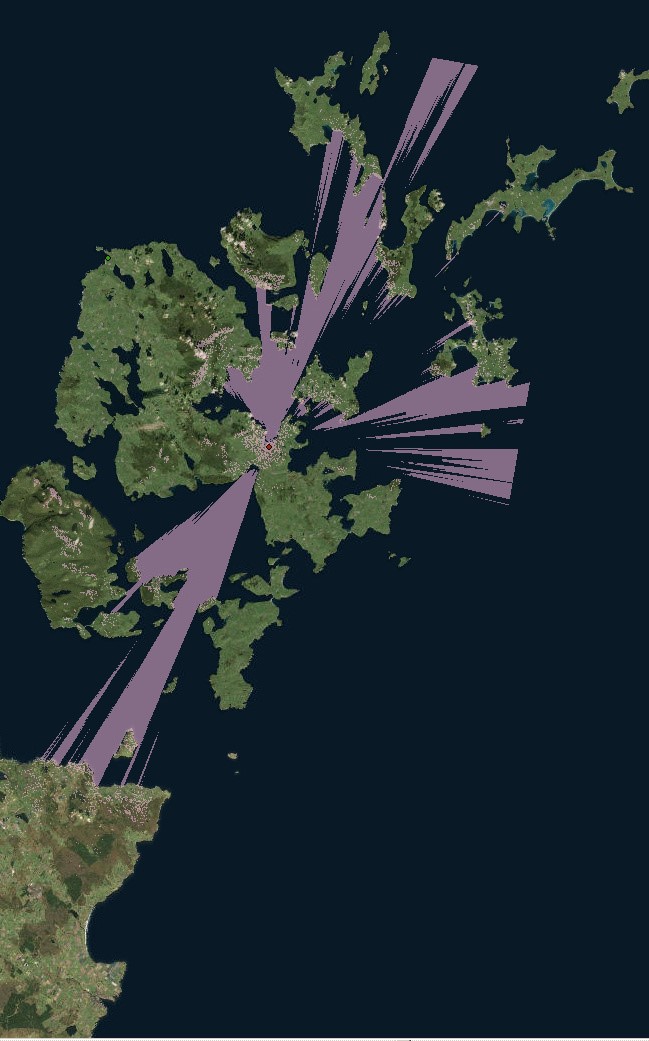
The height of St. Magnus Cathedral varies in secondary literature, so I selected the measurement (and Offset A) of 133 feet (roughly 40 meters) from the nineteenth-century work of Sir Henry Dryden, who visited and sketched the cathedral before a new, taller spire was added. The generated viewshed appears in pink on the viewshed to the left, visualizing not only what is visible from that point at that height, but also from where the tower itself could be seen.

(left) The northwestern view from the tower of St. Magnus Cathedral; (right) St. Magnus Cathedral from the Pentland Firth to the south.

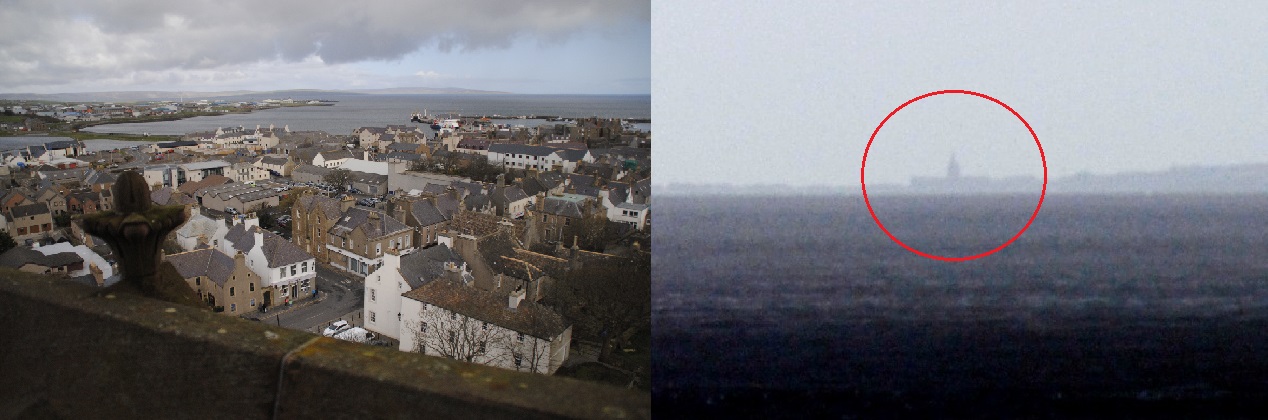
I later tested the validity of the data on the ground by tracking when the cathedral became visible from multiple locations and recording the view from the tower myself. St. Magnus Cathedral’s viewshed orientation toward the sea helped to narrow my research question and prompted my second viewshed analysis, which I will discuss in a second blog post.

Leave a Reply

You must be logged in to post a comment.

Recent Posts

  • The Untold History of Fletcher Street’s Stables April 21, 2025
  • Building an Immersive Archive of the Greek Orthodox Churches in Istanbul April 15, 2025
  • Tracing Influence in Genealogies of Communication Theory April 14, 2025

Tags

3D modeling 3D printing arduino augmented reality banned books coding corpus building critical making Cultural Heritage data cleaning data visualization Digital Preservation digital reconstruction digital scholarship film editing game design games gephi human subject research linked open data machine learning makerspace makerspace residency mapping network analysis oculus rift omeka OpenRefine Photogrammetry Python QGIS R SketchUp stylometry text analysis text mining textual analysis top news twitter video analysis virtual reality visual analysis voyant web scraping webscraping

Recent Posts

  • The Untold History of Fletcher Street’s Stables April 21, 2025
  • Building an Immersive Archive of the Greek Orthodox Churches in Istanbul April 15, 2025
  • Tracing Influence in Genealogies of Communication Theory April 14, 2025

Archives

Meta

  • Log in
  • Entries feed
  • Comments feed
  • WordPress.org

Archives

Blog Tags

3D modeling (11) 3D printing (14) arduino (8) augmented reality (5) banned books (3) coding (12) corpus building (4) critical making (7) Cultural Heritage (11) data cleaning (4) data visualization (11) Digital Preservation (3) digital reconstruction (9) digital scholarship (12) film editing (3) game design (3) games (6) gephi (3) human subject research (3) linked open data (4) machine learning (6) makerspace (8) makerspace residency (4) mapping (30) network analysis (17) oculus rift (8) omeka (3) OpenRefine (4) Photogrammetry (5) Python (8) QGIS (10) R (9) SketchUp (4) stylometry (8) text analysis (10) text mining (4) textual analysis (32) top news (102) twitter (5) video analysis (4) virtual reality (17) visual analysis (5) voyant (4) web scraping (16) webscraping (3)

Recent Posts

  • The Untold History of Fletcher Street’s Stables April 21, 2025
  • Building an Immersive Archive of the Greek Orthodox Churches in Istanbul April 15, 2025
  • Tracing Influence in Genealogies of Communication Theory April 14, 2025
  • From Theory to Practice: Weaving in Response to the Grid in the Global Context March 26, 2025
  • Visiting a Land of Twilight February 24, 2025

Archives

©2025 Loretta C. Duckworth Scholars Studio | Design: Newspaperly WordPress Theme
Menu
  • Scholars Studio Blog
    • Digital Methods
      • coding
      • critical making
      • data visualization
      • digital pedagogy
      • immersive technology (AR/VR)
      • mapping
      • textual analysis
      • web scraping
    • Disciplinary Fields
      • Anthropology
      • Archaeology
      • Architecture
      • Art History
      • Business
      • Computer Science
      • Critical Digital Studies
      • Cultural Studies
      • Dance
      • Economics
      • Education
      • Environmental Studies
      • Film Studies
      • Gaming Studies
      • Geography
      • History
      • Information Science
      • Linguistics
      • Literary Studies
      • Marketing
      • Media and Communication Studies
      • Music Studies
      • Political Science
      • Psychology
      • Public Health
      • Sculpture
      • Sociology
      • Urban Studies
      • Visual Art
    • Cultural Analytics Practicum Blogposts
  • Current Staff
  • Newsletter
  • About
    • Games Group