By Andrea Siotto
This is the introductory chapter to a series of articles on web scraping and data analysis in Python and C#:
If you are interested only in one section you can find the articles on the links below.
Maps are an incredible tool for understanding events. Oddly enough, historians are interested and fascinated by maps, but not really fond of using or making them. As a military historian, too many times I have had to read chapters full of regimental numbers, town names and detailed description of movements of troops with the help of a single rudimentary map, if any. Historians write books, are judged by colleagues on their writing, and teach with books. This is not changing anytime soon, and probably it should not. There is, however, an over-reliance on text, and an image could easily substitute pages of descriptions, making history more lean and easy-to-understand, qualities academia often forgets.
The problem is it is easy for a historian to write a few pages yet complicated to make a map. We are writers by trade and even if we manage to study Illustrator, Photoshop, or GIS, we often lack the skills to create a well-designed illustration. In addition, the collection of data and the use of it is time-expensive and often the academic world does not recognize the amount of work behind a single image (it is only one page!).
This post is precisely about that: data collection and project management in making maps.
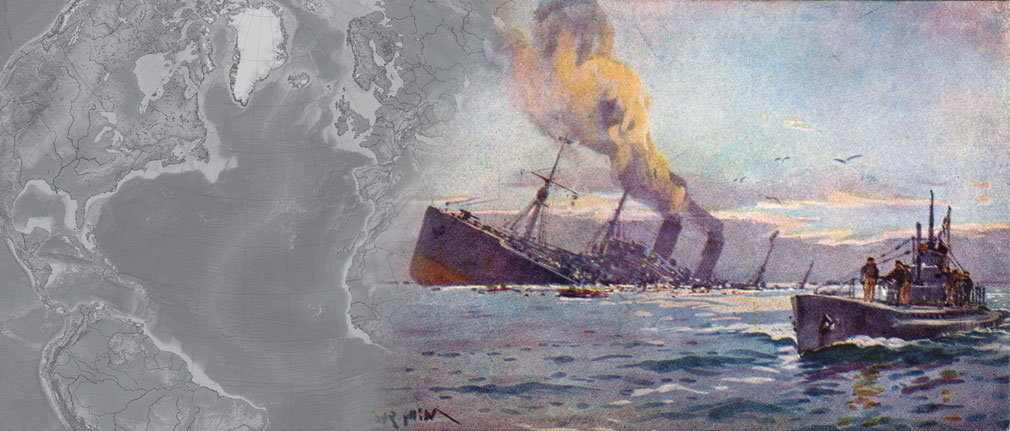
Incredibly enough, there is not a map of the First World War’s shipwrecks. At least not on the internet; not as an interactive map or video. Not that I can find. There is an interesting article on the Smithsonian website, with a map of the ships sunk by U-Boat attacks, however there is no sign of the ships lost because of sea mines or other reasons.
Where is the data?
To map the ships we need a list of them. The list should contain the name of the ship, the date of sinking, the location, the reason of the sinking, and perhaps a description. The more data, the better, but the bare minimum should include the name and the position. With these two attributes it is possible to make a map, where a dot is in a certain position and has a certain name. Being minimalistic, a list of coordinates is enough to populate the map. However, if we want to do something more than a static image with dots, more information is needed.
Searching online, I didn’t find a free-to-access database of all the shipwrecks from WWI. We want online data machine readable data, or at least digitized documents we could potentially OCR, because we are talking about thousands of ships, and personally I don’t really enjoy the zen art of the manual transcription of data (that actually could take weeks).
One website has all the information necessary: a well-designed website and a detailed database of shipwrecks all around the world. However, after taking a week to program a web-scraping script that could manage the problem (the website is in ASP and the pages are full of JavaScript and really hostile to scraping), my IP was temporary banned because I was utilizing too much bandwidth for their website. I was doing nothing illegal, Google does it all the time, but I did not want to disturb the team that had clearly invested time and money in their database for shipwreck divers, so I diverted my attention to other places.
And here we find Wikipedia, with all the ships listed by date, organized in pages. These pages did not appear in my searches for shipwrecks, databases and similar researches, but they came out when I was searching for individual names of ships. Perfect! But it is Wikipedia, so there is not any assurance that the list is complete and accurate. Continuing the research however, I found a publication listing all the shipwrecks between 1824 and 1962[1] and a random check over the list online provide the necessary counter proof.
There were however a couple of problems:
- Not all the ships listed on Wikipedia have the coordinates of the sinking location
- The list is divided in pages by month, with tables that subdivide them into days.
The second problem is the easiest to solve: a simple Python Script can collect and organize the data for us.
The first problem is much more complex, because in the majority of the descriptions of the ships we can find the location in a format like “the ship hit a mine and sunk x nautical miles (y Km) south by south east from this location.” There is the data, but it is not the longitude and latitude numbers that we need to make the map.
The solution for the easy problem (in Python) will be the subject of the next post. The solution for the complicated one (in C#) will be the subject of a following one.
[1] Charles Hocking, Dictionary of Disasters at Sea During the Age of Steam: Including Sailing Ships and Ships of War Lost in Action, 1824-1962 (London: Lloyd, 1969).

