Research Resource Repository
- Dataset
Visualization on life happiness and tourism participation of U.S. counties
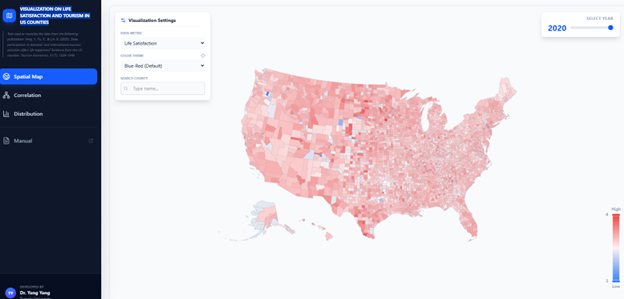
This web-based application is designed to visualize the longitudinal spatial-temporal relationship between resident life happiness and tourism participation across the United States. It is built upon the empirical research of Yang, Fu, and Lin (2025), which utilized a panel dataset covering over 3,000 U.S. counties to examine how domestic and international tourism activities influence subjective well-being.
Key Features:
- Spatial Visualization: Displays the geographical distribution of life satisfaction and tourism participation rates on an interactive map using the academic standard Albers USA projection.
- Correlation Analysis: Dynamically illustrates the statistical relationship between the change in tourism participation and life satisfaction.
- Distribution Analysis: Provides histograms for all variables to identify data characteristics, skewness, and outliers.
- Interactive Exploration: Allows users to customize the view by searching for specific counties, toggling years, and adjusting color schemes.
- Tool
MASEM of Risk Perception and Travel Behavior
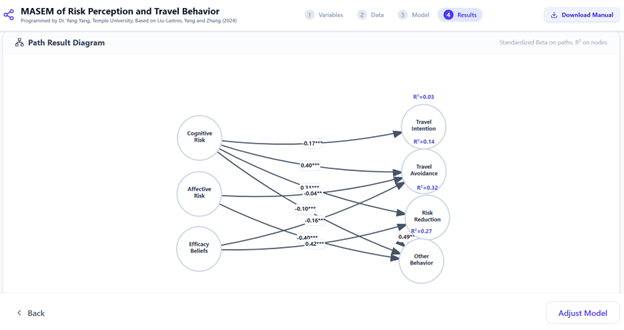
This web-based application is designed to conduct Meta-Analytic Structural Equation Modeling (MASEM) within the context of tourism risk perception. It is built upon the research of Liu-Lastres, Yang, and Zhang (2024), which synthesized findings from 108 articles to identify the optimal model explaining the relationships between tourists’ risk perceptions and behavioral outcomes during a pandemic.
Key Features:
- Replication: Users can replicate the testing of the 8 competing models (Model 1–8) proposed in the original paper (and beyond).
- Flexibility: The tool allows users to hide/restore specific variables to test simplified models or focus on specific relationships.
- Model Comparison: Users can save multiple model configurations and compare their Goodness-of-Fit indices (e.g., AIC, BIC, CFI) in a consolidated table to identify the best-fitting model.
- Visualization: Provides an interactive path diagram with auto-layout features (separating perception variables from outcome variables).
- Tool
Hotel Performance Under COVID
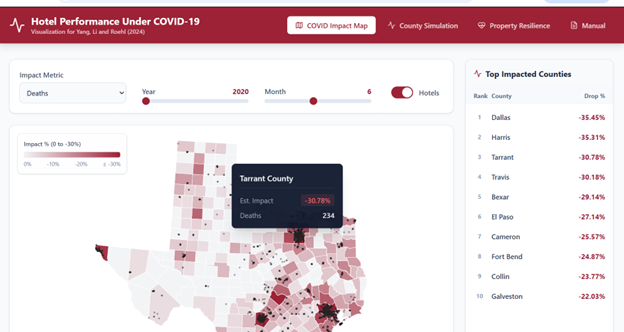
Tool link: https://uflyy.github.io/covid-impact
This interactive dashboard serves as the companion tool for the research paper in the reference. This tool bridges the gap between theoretical econometric models and practical hotel management, allowing stakeholders to visualize the historical impacts of COVID-19 deaths and cases on hotel revenue across various scenarios.
- Tool
Tourist Experience Simulation Tool

Tourist Experience Simulation Tool is a Web-GIS system designed to help tourism practitioners monitor and simulate tourist experiences under varying environmental conditions. This tool allows users to input specific scenarios defined by air pollution levels (specifically PM2.5), weather conditions (temperature, sun, wind, and precipitation), and date types (e.g., weekends or holidays). Utilizing a predictive algorithm derived from the sentiment analysis of geotagged social media posts, the system calculates “experience scores” to visualize the spatial distribution of tourist satisfaction across the city. This platform enables stakeholders to conduct scenario analyses, such as predicting experience fluctuations during heavy pollution events, and offers features for benchmarking specific locations and recommending itineraries that mitigate the negative impacts of poor air quality
- Dataset
Restaurant Resilience Index
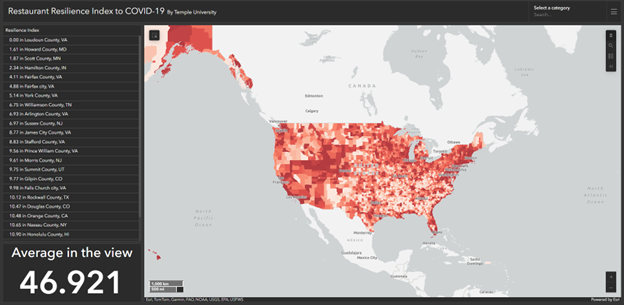
The Restaurant Resilience Index was developed to characterize the regional restaurant industry’s resilience to the COVID-19 pandemic across U.S. counties. Estimated from econometric results regarding daily restaurant demand, this index incorporates key moderating variables—specifically ethnicity, political ideology, dining habits (eat-in vs. off-premise), and restaurant diversity—that were found to influence the magnitude of demand decline caused by the pandemic and stay-at-home orders. By visualizing these data, potentially through tools like an ArcGIS dashboard, the index enables government entities and stakeholders to pinpoint geographically vulnerable areas and effectively allocate support resources, such as consumer voucher programs, to the hardest-hit local businesses.
Link to the Restaurant Resilience Index dashboard.
- Tool
Crime and Hotel Performance Tool
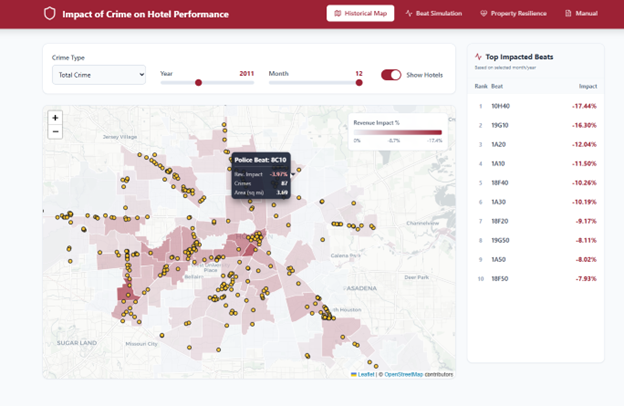
Tool link: https://uflyy.github.io/crime-effect/
This interactive dashboard visualizes the findings from recent literature regarding the intersection of urban crime and hospitality economics. It acts as a companion tool for two principal papers exploring vulnerability and resilience across hotel segments:
Hua, N., & Yang, Y. (2017). Systematic effects of crime on hotel operating performance. Tourism Management.
Yang, Y., & Hua, N. (2020). Does hotel class moderate the impact of crime on operating performance? Tourism Economics.
Historical Map Module
The Historical Map projects Houston Police Beats alongside hotel establishments to monitor absolute crime counts and estimate percentage impacts on monthly hotel revenue. Built on interactive OpenStreetMap tiles, the module applies a dynamic choropleth rendering. Visual mapping allows stakeholders to hover over regions and examine geographical clustering of property crimes versus violent crimes across the 2009–2014 timeframe.
Beat Simulation
The Beat Simulation assists developers and asset managers in understanding systemic risk. By selecting a localized police beat, the tool automatically preloads the local hotel class composition and average room counts. Crucially, users can manually override these portfolio metrics—adjusting the total number of hotels, room capacity, and class distribution (Economy, Midscale, Upscale, Luxury)—to create custom “What-If” development scenarios. This enables rapid estimation of theoretical monthly dollar losses applied to aggregate capacity against hypothetical spikes in criminal incidents.
Property Resilience
Guided by the Routine Activities Theory framework addressed in Yang and Hua (2020), this module recognizes that higher-end hotels exhibit significantly higher threshold resistance against crime externalities due to intensive site hardening. The Resilience Module computes an indicative score comparing specific asset profiles (Class segment & Scale) against market benchmarks.