Tool link: https://uflyy.github.io/restaurant-week/
Academic Reference:
Yang, Y., Yin, Q., Hwang, G. K., Liang, S., & Yang, D. (forthcoming). Restaurant week paradox: Asymmetric effects of event-based marketing on online engagement. International Journal of Contemporary Hospitality Management.
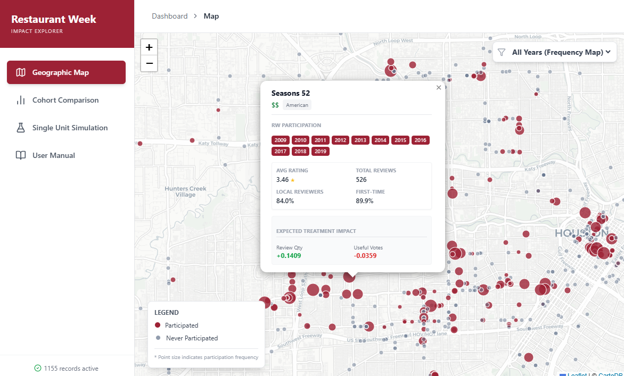
1. Geographic Map View
- Year Filtering: Use the dropdown in the top right corner to filter participation status by a specific year.
- Frequency Mapping: If “All Years” is selected, the size (radius) of the cherry-red markers expands dynamically based on the total number of years a restaurant has participated.
- Interaction: Click on any marker to open an information popup with historical baseline data and predictive metrics.
2. Cohort Comparison
- Purpose: Compares the structural and baseline performance differences between restaurants that participated in RW versus those that did not.
- Visual Variables: Recharts-based grouped bar charts are used to visualize the mean values of quantitative variables (Rating, Review Volume, Local/First-time mix) and the proportional makeup of categorical variables (Price Level, Fine Dining status).
- Frequency Histogram: When filtering by “All Years”, a unique frequency distribution chart activates, revealing the historical retention and loyalty of participating restaurants.
3. Single Unit Simulation
- Purpose: A sandbox environment detached from the map data. It allows you to model hypothetical scenarios based on econometric estimation formulas.
- Controls: Adjust the baseline consumer mix (Local Reviewers and First-Time Reviewers) and toggle the Fine Dining status to see real-time marginal treatment effects.

You must be logged in to post a comment.