How It Works:
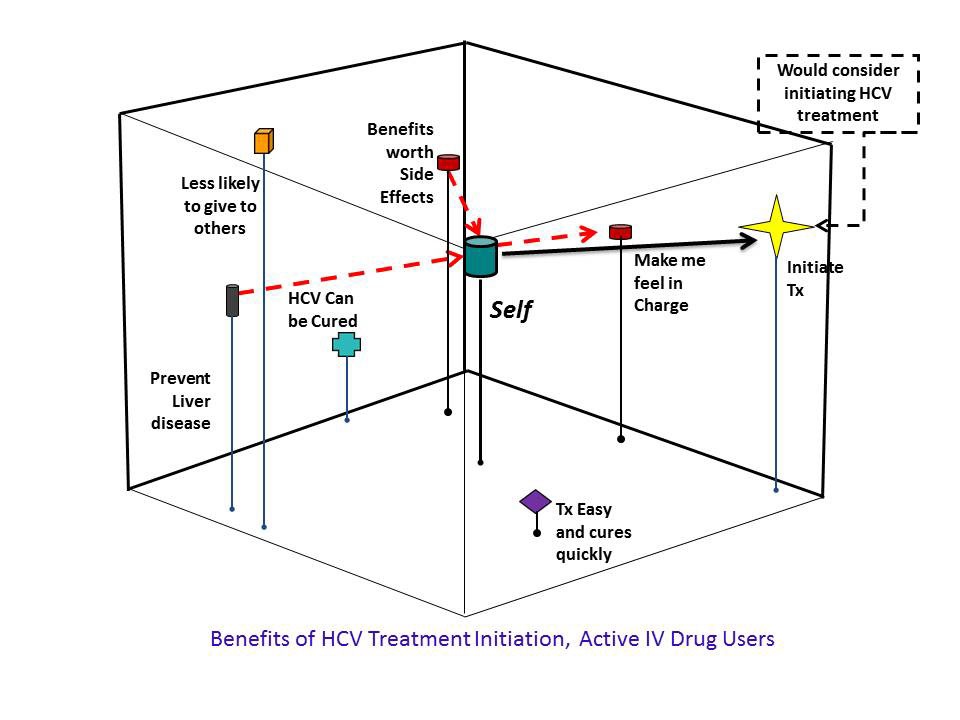
- Multidimensional Scaling (MDS) analysis is used to display relationships between a set of elements such as medical treatments, their perceived risks, and benefits.
- Respondents rate statements on a 0-10 scale, such as “The treatment for HCV is easy to take and cures quickly” or “The treatment for HCV will cause a lot of side effects.” These statements are designed to explore barriers and beliefs about decision-making or behavior change.
- Multidimensional Scaling software converts scaled judgments into distances, creating a perceptual map that visually represents how elements are related to each other as well as the group (“self”).
- The software then calculates “vectors” in how to move that self towards the decision. These become the key message strategies for the campaign or intervention.
- This method can also be used with segmentation analysis – we can compare maps and vector message models to see how messages are similar or different to understand how best to target interventions.
This approach ensures that we don’t overwhelm our audience with information. Instead, we highly target messages based on the audience’s existing conceptualization of risks and benefits. Just like marketers, this strategy allows us to only address things that will be persuasive to an audience.
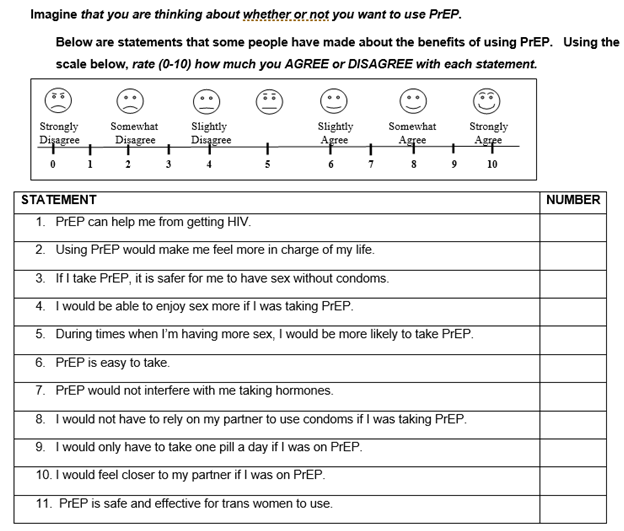
Example of Vector Message Modeling:
Our software is used to guide the mathematical vector resolution process (arrows in the map), helping to move a group toward a desired behavior, such as using PrEP for HIV prevention. The concepts identified in the perceptual map then form the basis for the targeted messages in the campaign.
The RCL uses eye tracking technology to ensure that health messages are designed to be accessible for individuals with varying literacy and numeracy levels.
- Eye tracking is extensively used in marketing research to understand how messages and materials are perceived by audiences.
- Eye movements indicate attention, helping to gauge how information is processed. This provides unique insight into consumer understanding of health communication, especially when messages involve both visual and textual elements.
- This tool helps us understand how individuals process information and whether they need to re-read sections due to literacy challenges.
The following videos and text reference material from an article written by Dr. Sarah Bass entitled “Use of Eye-Tracking and Gaze Pattern Analysis to Test Health Messages in Low-Literacy Groups“
![]()
Eye-tracking was used on a project that developed literacy–appropriate education about bioterrorism for low-literacy adults. Eye tracking output can clearly differentiate whether an individual is reading text as expected or if they instead have to read and then re-read sections because of literacy ability. If presented with material that is above literacy and/or numeracy levels, eye tracking can be used to show areas where individuals have difficulty accessing the content, which can then be related to other outcome measures.
See these videos:
| Below are two clips of the eye movements of a subject using eye tracking software. Eye-tracking can produce vivid data that shows not only gaze duration (green dots; the size indicates the length of the gaze) but also gaze pattern (blue line). | |
| In this clip you can see the participant’s eye movements are varied, sporadic, and go off the text many times. Our research team can determine whether the participant’s eye movements convey a sense of understanding of the message. In this example, the participant may have trouble recalling and understanding the information presented. | |
| Here the participant’s gaze remains on the text for the majority of the clip. The participant reads the sentences in order and without many eye movements straying outside of the text. Furthermore, the participants takes time to look at the image after he/she reads the text. In the second example, the participant will most likely be able to recall and understand much of the information presented. | |
The RCL uses pupil dilation technology to measure a participants’ interest or attention to information.
- As a person’s interest/attention increases, pupil dilation increases.
- This is true for both emotionally pleasant and unpleasant stimuli.
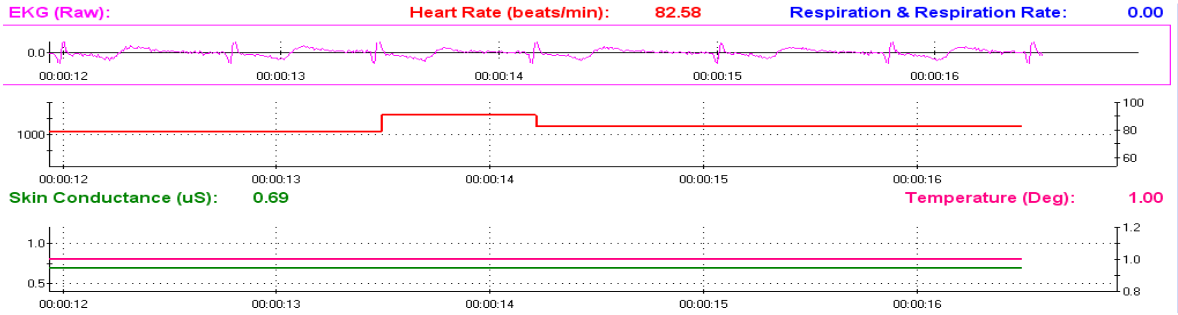
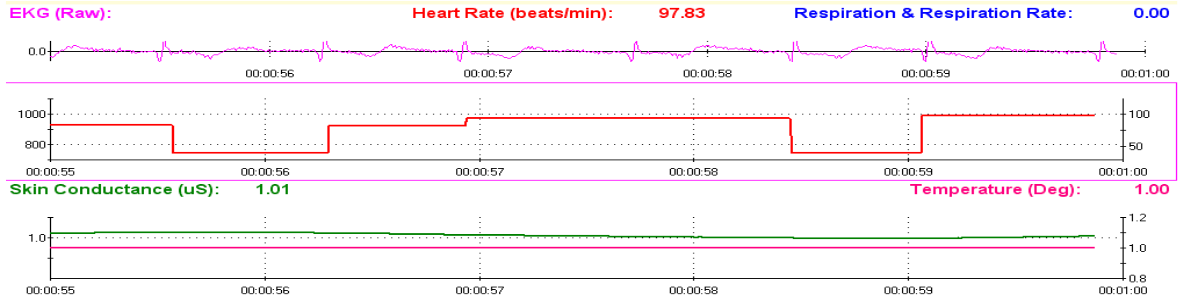
The RCL uses physiological response technology to measure the extent to which the message is having an emotional impact on the participant.
- Physiological Responses include:
- Heart Rate
- Body Temperature
- Skin Conductance or Sweating
- EEG Brain Response Patterns
- ]These physiological measures can be simultaneously assessed with the eye-tracking/pupil dilation.
- This is especially useful in perceived high risk or high fear situations, such as bioterrorism or disease outbreaks.

Skin Conductance and EKG Output Part of the eye-tracking study with people with low literacy used these methods to assess whether heart rate, body temperature and skin conductance could show whether having materials that either did or did not match literacy levels had an effect on these measures. Here is an example of output of these measures in intervention and control group participants looking at content similar slides. Intervention Group Participant Control Group Participant |