Over the past eight weeks, I have been working for PHS for my capstone project. As many may have seen my updates on this site. The project has pretty much come to an end and been troubleshot! Because of this, I have taken on a few additional projects that I will post about. This project, sought to find an easy way to create a route that we could give to contractors instead of just a bunch of addresses that they would have to sort through themselves. In an effort to do this, I utilized Network Analyst in ArcMap as the team is familiar with the tools and their functionality. Below, I have included the step by step guide that I gave to the team for the future as well as a few pictures of the outcome!
Each route will be designated by pre-defined groups of sites if they exist for the data that is being managed. This tutorial will use the Maintenance Only (MO) Reentry Site Shapefile as an example.
- Navigate to and add the following shapefiles to ArcMap:
- “U:\PhiladelphiaLandCare2\06_AllCurrentYearWork\2017\Shapefiles\MO_Reentry_parcels2017_ACYW.shp”
- “U:\02_External_data\Streets\Phila\Phila_Street_Centerline_ND.nd”
- Enable the ‘Network Analyst’ toolbar under the Customization tab on the top left of ArcMap. You may need to go to the extensions tab, also under Customization and enable Network Analyst as well. This is only necessary if you have never used Network Analyst before.
- Once we have enabled the toolbar, it should pop-up in the middle of the ArcMap window. This is okay, but feel free to move it if you are bothered. Look around the tool and get a feel for the set-up. Be sure to enable the ‘Network Analyst Window’ as we will take advantage of this in later steps. This is the first icon from the left.
- Next, using the dropdown menu in Network Analyst, select ‘New Route’. This will add a series of empty layers to both the Analyst Window and the Table of Contents.
- We will next add the points or ‘Stops’ as the route generator calls them to the Analyst Window. Before we can do this, we will need centroids of our sites we are routing.
- To begin, navigate to the attribute table of the MO parcels shapefile. Add two fields with the following names with the field type as ‘double’: x_coord and y_coord.
- Next, right click on the name of the field in the attribute table. Navigate to ‘Calculate Geometry’. Click next until you get to the main window. Here set the geometry we are calculating to the respective centroid field (x_coord calculates ‘X Coordinate of Centroid’). Repeat this with the other coordinate.
- Export the attribute table as a ‘.dbf’ to your workspace. Add the table to the map image.
- Right click on the table in the table of contents. Navigate to ‘Display XY Data’. Here, set X = x_coord and Y = y_coord. Click okay. You should now see centroids for all the MO sites in Philadelphia County.
- Export the table to your working folder and add the shapefile to the map. This will be our centroid shapefile for the remainder of the assignment.
- Next, we will add the centroids to Network Analyst as ‘Stops’. To do this, right click on ‘Stops’ in the Network Analyst Window on the far left of your screen. Navigate to ‘Load Locations’. Set the ‘Sort Field’ and ‘RouteName’ to the grouping factor. For many shapefiles, this will be ‘Group’ or ‘Group_Number’. In this shapefile, the grouping factor is ‘Contractor’. Leave all other factors as they are. Once this is done, click okay. The loading may take a moment.
- Now we will make the routes. To do this, go back to the Network Analyst Toolbar and click on the small button labeled ‘Solve Network’. Be patient as this may take a bit of time again.
- A series of routes should now be visible for reach of the contractors or groups that we based our breaks on or ‘Sort Field’. To see where the stops are along the routes, select the ‘Network Directions’ button, again on the Toolbar. Each route will be displayed with the stops along the routes and the address of each site. Export this table as you see fit, as these are your results. Be patient working through this as there are many sites run through each time.
- Note: It may work to partition the sites into smaller shapefiles before the Solve is run. This would occur via a ‘Select by Attribute’ for the group or groups in question, then perform steps 6 – 8 for each individual group. This would be tedious to select each group, but could speed up processing slightly without coding the process externally.
- Each route can be exported individually by right clicking it in the Network Analyst Window and selecting export. If the entire shapefile is exported at once, each route will be combined into one. This could be broken down using the geoprocessing ‘Dissolve’ function if you would like to streamline with only two steps.
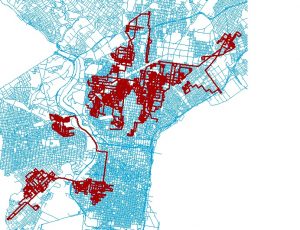
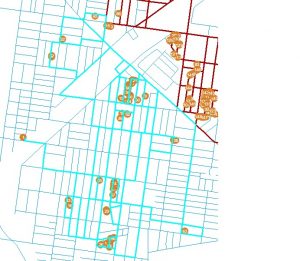
Below, the first image is of all routes created using the Philadelphia County Streets Network. The second image shows one route zoomed in with the sites that are navigated to.