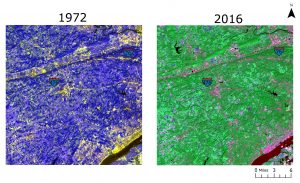
This past semester, through my remote sensing course, I had the opportunity to analyze land changes that result from the construction of highways. Specifically images from 1972 and 2016 of route 476 were analyzed using remote sensing software. The land analyzed was tested for changes in urban spaces, grass, forest, and water. These for areas allowed for the best analysis with the most understandable results. The original composite images (bands 4, 5 and 7) are shown below prior to any testing or remote sensing analysis.

Highway 467 was the primary area of interest for this analysis as the construction in the Philadelphia area was regarded as highly controversial. Construction of the highway took many years, and removed many homes, trees, and other green space. This analysis sought results showing the amount of green space removed for construction purposes. This area would have been replaced with urban space.
Results were calculated using some ArcMap analysis but primarily ENVI software was used. All final maps were edited for readability and clarity using Adobe Illustrator. The following analysis was performed: a tasseled cap analysis, a supervised land classification using a majority analysis, and land change results were calculated.
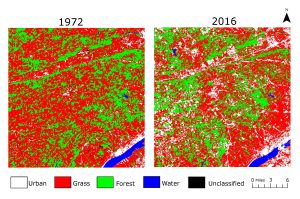
Shown below, the classification shows the land in the original state (1972) and the final state (2016). It is evident when viewing this map, that there was some change in land type from grass or forest to urban spaces. While much of this was due to highway construction, it could be interpreted that the highway led to the urbanization of the surrounding suburbs.

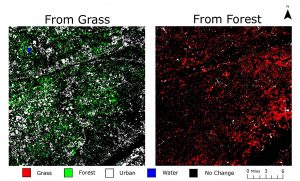
The image below is a deeper explanation of the land that changed from forest or grass to the new land it consists of. What seemed interesting with these results were that much of the forest land changed to urban but also grass land. This was also similar with grass land and vice versa. One consideration for this could have been the increased interest in large green backyards. While many new homes were constructed, these homes typically had large sprawling yards. The area analyzed is primarily upper class when median household incomes were considered in this analysis.

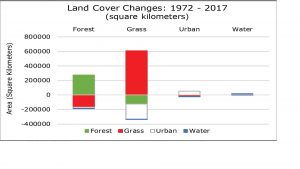
Finally, the image below depicts the actual land changes from one category to another when analyzed in square kilometers. As was unexpected, much of the forest and grass land changed from one to the other. Yes, urban space was gained significantly, but the amount of grass and forest retained was entirely unexpected. Future analysis should consider the type of forest growth (primary, secondary, etc) to determine the overall growth and health of the newly greened land spaces.

The overall results of this project showed that much greenspace was lost to urbanization with the construction of highways, but much land was retained and converted to other types of greenspaces. Future analysis suggests that a consideration of these new greenspaces be tested. While greenery is implemented, the overall health of the area has not been considered. As many plain greenspaces can harm environmental health, forest density versus grass should be regarded as an important future testing point.
