
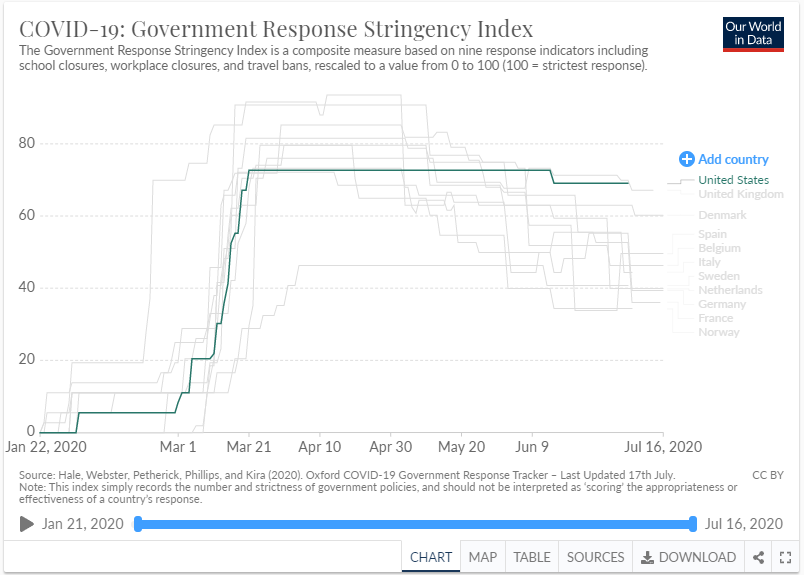
On Wednesday, the economist Phil Magness posted this tweet with a graph from OurWorldInData (which I reproduce because his graph is hard to read in his tweet).
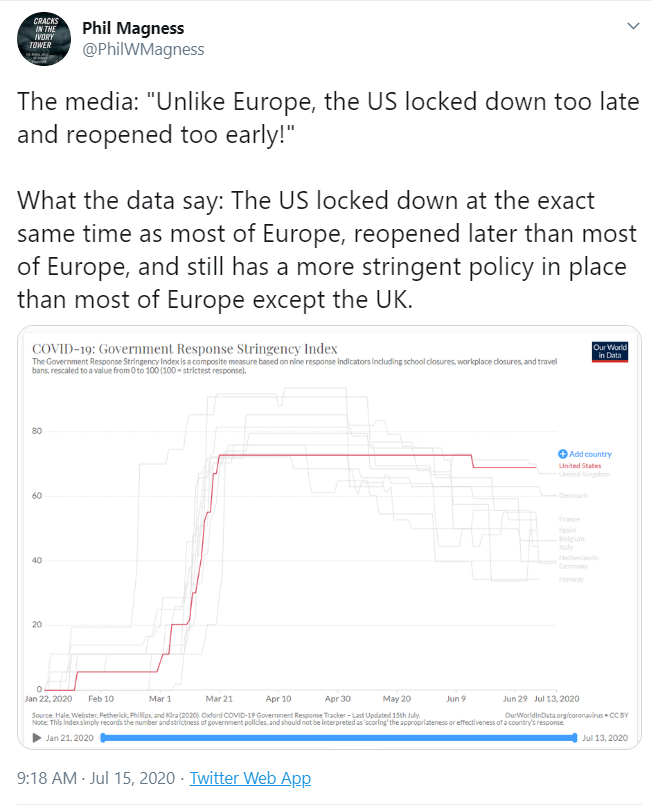
I have looked at different take-downs of the U.S. policy response to COVID, and a supposed late start of lock-downs has not been a prominent theme. Mostly writers have been focusing on the lack of testing, the lack of protective gear for medical workers, Trump’s idiotic pronouncements about the virus, and Trump’s mismanagement of Sino-U.S. relations (e.g. Vox 6/8, Atlantic 6/28, Time 7/1, USA Today, er, yesterday). But maybe Magness has a point. Early on during the pandemic there was ire directed towards the federal government’s lack of guidance and devolving responsibility to states, municipalities, and private actors (see Atlantic 3/14). And now people are making the connection between states’ re-opening and the new surge in COVID-19 cases (e.g. New York 6/29).
Or does he? The graph he posted uses data from the Oxford COVID-19 Government Response Tracker (OxCGRT) put together by researchers at the Blavatnik School of Government at the University of Oxford. The OxCGRT is an index (also known as a scale), that is, a statistic that aggregates (usually through summing or average) measures of different but related concepts to get the best measure of some broader concept. One index that statistics professors have a lot of fun with are college rankings, as the inclusion and weighting of different measures/concepts tend to be pretty arbitrary, especially with the U.S. News and World Report rankings. Joel Best, in More Damned Lies and Statistics, says that we risk turning such indices into magical numbers where we do not pay attention to the decisions that went into creating the index, and hence accord them an authoritativeness they do not deserve.
Magness’s graph focuses specifically on the OxCGRT’s “stringency” index (they have multiple indices). This index is based on nine measures:
- C1 • School closings (0-3)
- C2 • Workplace closings (0-3)
- C3 • Cancellation of public events (0-2)
- C4 • Restrictions on private gatherings (0-4)
- C5 • Closing public transport (0-2)
- C6 • Stay at home requirements (0-3)
- C7 • Restrictions on internal movement (0-2)
- C8 • International travel controls (0-4)
- H1 • Public information campaigns (0-2)
Having looked into the construction of this index, I would be cautious about using it make comparisons over time, but especially between countries (as Magness does). There’s a couple of problems with the index:
First, there is the matter of actually quantifying government responses to COVID. The OxCGRT team are not very clear on how exactly they took public information and scored it. I am not sure what sources they consulted to score government actions (I am guessing news reports?). Plus, deciding what value to assign a country seems to involve a level of personal discretion for the coder. Take, for example, measure C2, workplace closings. Their codebook describes the meaning of the four possible values this measure can take:
- no measure
- recommend closing (or work from home)
- require closing for some sectors or categories of workers
- require closing for all-but-essential workplaces (e.g. grocery stores, doctors)
The difference between 2 and 3 is quite blurry, especially depending on how broad a country defines “essential” workers. Bear in mind, the OxCGRT team–consisting of six primary investigators and over 120 contributors–are measuring these things for each country twice a week. Maintaining consistent coding for many cases over so many dates, and coordinating this across over a hundred people seems terribly daunting to me.
But set this aside. These are public policy scholars, maybe we can trust their subjective assessments. But we have another issue–what do they do about intra-national heterogeneity in policy response? After all, in the United States, state governments, not the national government, have been making the call to “lockdown” or “reopen”. Here is what the OxCGRT team say:
Government coronavirus policies often vary by region within countries. We code the most stringent government policy that is in place in a country, as represented by the highest ordinal value. Sometimes the most stringent policy in a country will only apply to a small part of the population.
This is a big, big problem. In other words, a country like the United States is being recorded as having the policy response of the most stringest state. Magness wants to use this graph to compare the US to other European countries, and conclude that the U.S.’s policy was just like other European countries’, but the reality is that the U.S. has an unusual federal system of government with a lot of power delegated to the states. By using the OxCGRT index, he is really comparing the stringest state to other European countries. He is stacking the deck in favor of his conclusion that the U.S. was like other European countries and is not suffering from a lack of lockdown.
Now, all is not lost for Magness’s case. The OxCGRT team have a statistical fix for this issue: if a country has a COVID policy response that was “targeted”, the country’s score for that particular indicator is penalized. But here is where you can see all of the cumbersome, arbitrary decisions that go into index construction. How is that score penalized? By half a point. So, in the United States, for most of the lockdown period it has been coded as “3” on the “workplace closings” indicator, meaning “require closing for all-but-essential workplaces”. When the OxCGRT team aggregate the measures into the stringency index, they express them as out of 100, so the U.S.’s score without the penalty would be 3 out of 3, or 100%. But the OxCGRT data record nearly all of the U.S. policies as “targeted”, so the score that the OxCGRT index actually uses when it creates the stringency index is not 3/3 but 2.5/3, or 83.3% (the half point penalty turns into a 17 percentage point penalty).
But if you look at my list above, you can see that not all of the measures have a range of 0-3. Cancellation of public events has a range of 0-2. For most of the lockdown period, the U.S. is coded as 2/2, but since this policy was targeted in the U.S., the score used to construct the index is 1.5/2, or 75% (the half-point penalty turns into a 25 percentage point penalty). Likewise with restricting private gatherings: the U.S. is again mostly coded as 4/4, but again, this is targeted, so the score used to construct the index is 3.5/4 or 87.5% (the half point penalty turns into a 13 percentage point penalty). So the fact that the U.S. has a federal system results in a penalty that is alternatively 13, 17, or 25 percentage points. See how arbitrary this is? And are these penalties even in the correct ballpark for evaluating how “targeted” or “general” a policy is in the United States? Beats me, but it is also evident that is something the OxCGRT people are not concerned with. But this index allows someone with an agenda, who wants to argue that the U.S. has had too much lockdown, to use this scale to push that argument without really thinking about how to compare a federal system like the U.S. to more centralized governments.
If you want to see how unique the U.S. is among the countries in the OurWorldInData graph, for each measure, here is the proportion of times the policy was coded as “general” (as opposed to “targeted” by OxCGRT.
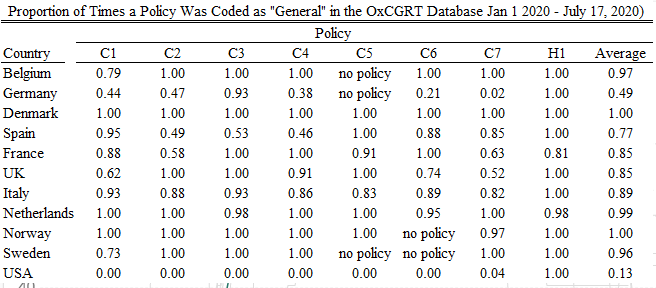
Essentially, for all of the days and aspects when and where the United States was coded as having a COVID-19 containment policy, only in 13 percent of them were they general policies. The country that comes next after the United States in relying on targeted policies? That is Germany, which is not surprising since the U.S. imposed the federal model on Germany after WWII. What is surprising is that even a federal system like Germany still has general policies in 49 percent of the days and aspects. The remaining countries are at 77 percent or higher.
If I were a libertarian and wanted to argue that lockdowns were not the solution to COVID-19, and that the U.S. has had too much lockdown, I would probably not take too much solace in the OxCGRT data. If anything, I would be worried by the implication of the federal system in a government’s failure to respond to COVID-19.