Introduction
This web-based application is designed to visualize the longitudinal spatial-temporal relationship between resident life happiness and tourism participation across the United States. It is built upon the empirical research of Yang, Fu, and Lin (2025), which utilized a panel dataset covering over 3,000 U.S. counties to examine how domestic and international tourism activities influence subjective well-being.
Key Features:
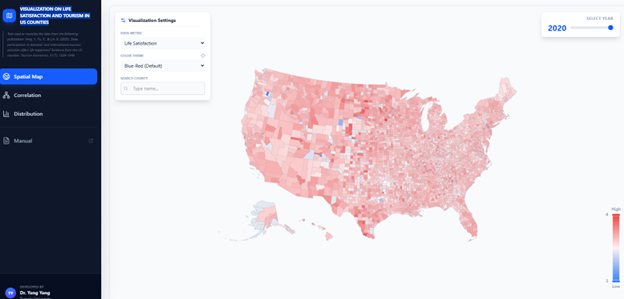
- Spatial Visualization: Displays the geographical distribution of life satisfaction and tourism participation rates on an interactive map using the academic standard Albers USA projection.
- Correlation Analysis: Dynamically illustrates the statistical relationship between the change in tourism participation and life satisfaction.
- Distribution Analysis: Provides histograms for all variables to identify data characteristics, skewness, and outliers.
- Interactive Exploration: Allows users to customize the view by searching for specific counties, toggling years, and adjusting color schemes.