Introduction
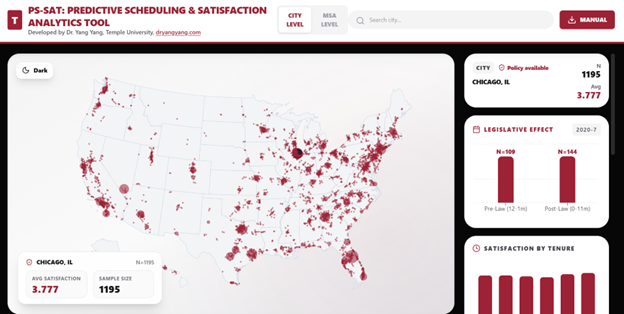
This web-based dashboard is designed to visualize tourism and hospitality employee satisfaction data across U.S. geographic units at both the City and Metropolitan Statistical Area (MSA) levels. The application provides interactive mapping, subgroup breakdowns, and (where applicable) legislative pre– and post–comparisons.
Key Features:
- Dual-Level Geographic View: Users can switch between City-Level (point markers) and MSA-Level (polygon map) visualization.
- Interactive Search & Selection: Users can search locations dynamically and select them either via the map or the dropdown search interface.
- Subgroup Breakdown Analysis: Satisfaction scores are displayed by:
-
- Job tenure
- Business model
- Skill level
- Front-of-house vs. back-of-house
- Legislative Effect Comparison: For locations with valid policy-period data, the dashboard displays Pre-Law vs. Post-Law satisfaction comparisons.
- Visual Encoding of Sample Size: City marker size scales with sample size (N), allowing immediate identification of data-rich locations.