Introduction
Tool link: https://uflyy.github.io/natural-disaster/
This interactive dashboard serves as the companion tool for the research paper Nam and Yang (2026): Hotel performance under extreme weather: a contingency perspective on organizational resilience, published in the Journal of Sustainable Tourism (Link). This tool bridges the gap between theoretical econometric models and practical hotel management, allowing stakeholders to visualize the historical and future impacts of natural disasters on hotel revenue across various scenarios.
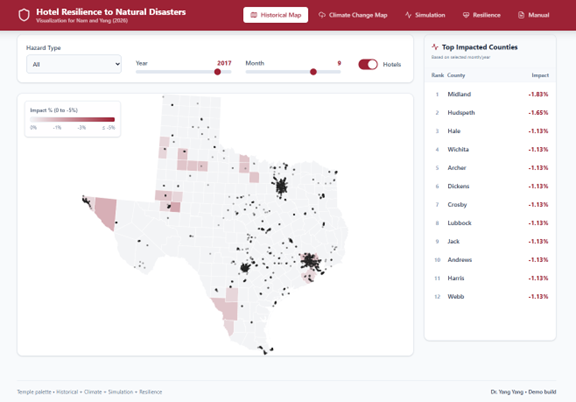
The Historical Map provides a geospatial visualization of actual hazard impacts across Texas counties. By selecting specific hazard types (e.g., flooding, hurricane, hail) and historical timeframes (2002-2019), users can observe the distribution of past events and the estimated percentage impact on local hotel performance. The top 10 most severely impacted counties for the selected month are dynamically highlighted.
The Climate Change Map allows stakeholders to conduct forward-looking macro stress tests. By anchoring on the 18-year annual average of specific historical hazards, this module enables users to project future spatial risks by adjusting the frequency deterioration slider (e.g., +20% flood frequency). It maps how a shifting climate trajectory will aggravate expected annual hotel revenue damages across different counties over the long term.
The Simulation Module equips hotel portfolio managers to estimate financial losses under hypothetical disaster severities. Users can configure an aggregate portfolio’s characteristics—including ownership mix (independent vs. chain vs. franchise), hotel class structure, and baseline revenue—to analyze how these organizational boundaries mitigate or exacerbate absolute revenue loss during a hazard shock.
The Resilience Module translates the study’s empirical findings into a scoring system for individual properties. By inputting key hotel determinants such as room count, operational age, and chain affiliation, the tool computes a normalized ‘Resilience Score’ (0-100). This score is benchmarked against predefined industry percentiles, empowering owners to understand their property’s inherent capacity to withstand extreme weather disruptions.