Econometrics
Recommendation
- Article
- US
- Econometrics, Big Data
Yang, Yang; Tan, Karen Pei-Sze; Liu, Yi Vanessa
- Article
- US
- Econometrics
Nam, Yoonyoung; Yang, Yang
- Article
- China
- Econometrics, Big Data
Yang, Lisi; Yang, Yang; Huang, Xijia; Yan, Kai
Related Presentations
- Keynote
- 07/21/2024
Review of research in tourism economics
2nd Xishan Economics Forum
Guiyang, China
- Presentation
- 06/04/2018
Econometric and big data analytics in tourism research
Workshop in Guilin Tourism University
Guilin, Guangxi, China
- Invited Talk
- 03/04/2024
COVID19tourism Index and its application in tourism management
University of Perpignan
Perpignan, France
- Invited Talk
- 06/16/2014
Spatial econometrics in tourism and hospitality management
CICtourGUNE research center
San Sebastian, Spain
Related Resources
- Tool
Rating Adjustment Tool
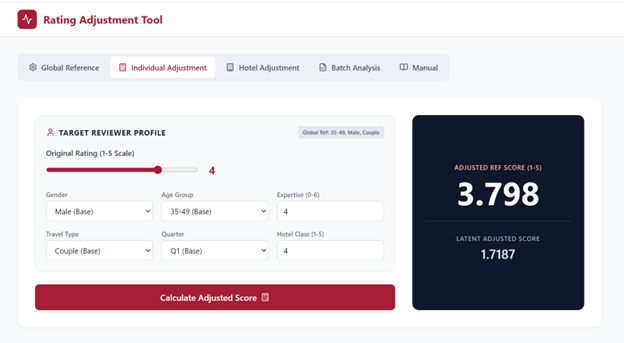
Tool link: https://uflyy.github.io/rating-adjustment/
The Rating Adjustment Tool is an advanced analytical web application designed to standardize hotel online reviews by correcting for “scaling heterogeneity”—the phenomenon where different types of reviewers interpret and use rating scales differently. Powered by a Hierarchical Ordered Probit (HOPIT) model grounded in peer-reviewed academic research , the tool mathematically controls for systematic response biases tied to traveler demographics (such as age and gender) and trip characteristics (such as travel type and reviewer expertise). By offering individual review adjustments, hotel-level aggregate score calculations, and batch CSV processing, the tool effectively translates subjective, raw user ratings into objective, comparable latent scores and standardized 1–5 metrics, ensuring fairer and more accurate hotel evaluations.
This rating adjustment tool is built on the theoretical framework and empirical results from the following paper:
Leung, X. Y., & Yang, Y. (2020). Are all five points equal? Scaling heterogeneity in hotel online ratings. International Journal of Hospitality Management, 88, 102539.
- Tool
Hotel Resilience to Natural Disasters Tool
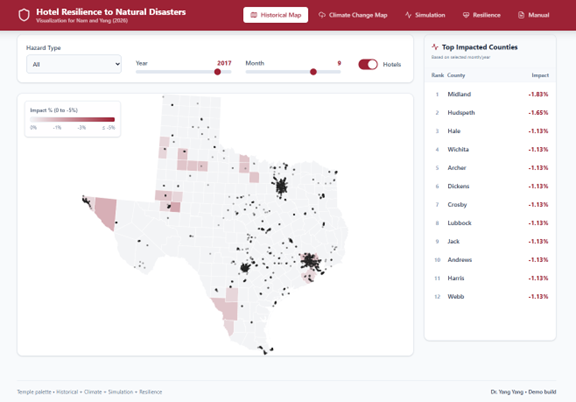
Tool link: https://uflyy.github.io/natural-disaster/
This interactive dashboard serves as the companion tool for the research paper Nam and Yang (2026): Hotel performance under extreme weather: a contingency perspective on organizational resilience, published in the Journal of Sustainable Tourism (Link). This tool bridges the gap between theoretical econometric models and practical hotel management, allowing stakeholders to visualize the historical and future impacts of natural disasters on hotel revenue across various scenarios.
The Historical Map provides a geospatial visualization of actual hazard impacts across Texas counties. By selecting specific hazard types (e.g., flooding, hurricane, hail) and historical timeframes (2002-2019), users can observe the distribution of past events and the estimated percentage impact on local hotel performance. The top 10 most severely impacted counties for the selected month are dynamically highlighted.
The Climate Change Map allows stakeholders to conduct forward-looking macro stress tests. By anchoring on the 18-year annual average of specific historical hazards, this module enables users to project future spatial risks by adjusting the frequency deterioration slider (e.g., +20% flood frequency). It maps how a shifting climate trajectory will aggravate expected annual hotel revenue damages across different counties over the long term.
The Simulation Module equips hotel portfolio managers to estimate financial losses under hypothetical disaster severities. Users can configure an aggregate portfolio’s characteristics—including ownership mix (independent vs. chain vs. franchise), hotel class structure, and baseline revenue—to analyze how these organizational boundaries mitigate or exacerbate absolute revenue loss during a hazard shock.
The Resilience Module translates the study’s empirical findings into a scoring system for individual properties. By inputting key hotel determinants such as room count, operational age, and chain affiliation, the tool computes a normalized ‘Resilience Score’ (0-100). This score is benchmarked against predefined industry percentiles, empowering owners to understand their property’s inherent capacity to withstand extreme weather disruptions.
- Tool
PS-SAT: Predictive Scheduling & Satisfaction Analytics Tool
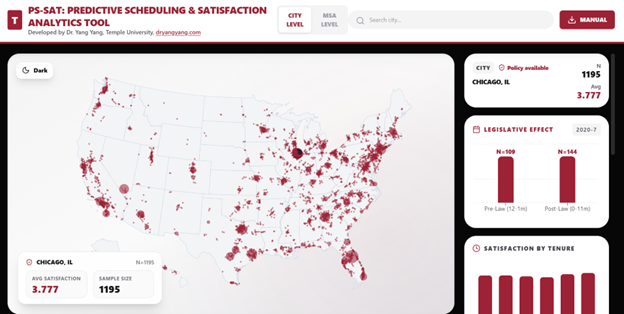
This web-based dashboard is designed to visualize tourism and hospitality employee satisfaction data across U.S. geographic units at both the City and Metropolitan Statistical Area (MSA) levels. The application provides interactive mapping, subgroup breakdowns, and (where applicable) legislative pre– and post–comparisons.
Key Features:
- Dual-Level Geographic View: Users can switch between City-Level (point markers) and MSA-Level (polygon map) visualization.
- Interactive Search & Selection: Users can search locations dynamically and select them either via the map or the dropdown search interface.
- Subgroup Breakdown Analysis: Satisfaction scores are displayed by:
-
- Job tenure
- Business model
- Skill level
- Front-of-house vs. back-of-house
- Legislative Effect Comparison: For locations with valid policy-period data, the dashboard displays Pre-Law vs. Post-Law satisfaction comparisons.
- Visual Encoding of Sample Size: City marker size scales with sample size (N), allowing immediate identification of data-rich locations.

You must be logged in to post a comment.