Introduction
Tool link: https://uflyy.github.io/crime-effect/
This interactive dashboard visualizes the findings from recent literature regarding the intersection of urban crime and hospitality economics. It acts as a companion tool for two principal papers exploring vulnerability and resilience across hotel segments:
Hua, N., & Yang, Y. (2017). Systematic effects of crime on hotel operating performance. Tourism Management.
Yang, Y., & Hua, N. (2020). Does hotel class moderate the impact of crime on operating performance? Tourism Economics.
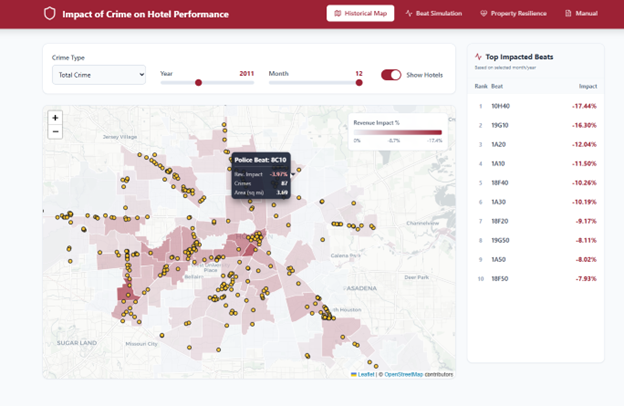
Historical Map Module
The Historical Map projects Houston Police Beats alongside hotel establishments to monitor absolute crime counts and estimate percentage impacts on monthly hotel revenue. Built on interactive OpenStreetMap tiles, the module applies a dynamic choropleth rendering. Visual mapping allows stakeholders to hover over regions and examine geographical clustering of property crimes versus violent crimes across the 2009–2014 timeframe.
Beat Simulation
The Beat Simulation assists developers and asset managers in understanding systemic risk. By selecting a localized police beat, the tool automatically preloads the local hotel class composition and average room counts. Crucially, users can manually override these portfolio metrics—adjusting the total number of hotels, room capacity, and class distribution (Economy, Midscale, Upscale, Luxury)—to create custom “What-If” development scenarios. This enables rapid estimation of theoretical monthly dollar losses applied to aggregate capacity against hypothetical spikes in criminal incidents.
Property Resilience
Guided by the Routine Activities Theory framework addressed in Yang and Hua (2020), this module recognizes that higher-end hotels exhibit significantly higher threshold resistance against crime externalities due to intensive site hardening. The Resilience Module computes an indicative score comparing specific asset profiles (Class segment & Scale) against market benchmarks.