

There are three main tools for debugging in Python.
In Python version less than 3, it was common to use the set_trace() command for making a starting debugger point, but in newer versions, it is possible to define the PYTHONBREAKPOINT environment variable before running the Python program and the debugger can be started by the breakpoint() command.
- pdb
This is the default debugger in Python. It is similar to gdb in Gnu Linux with very limited capabilities, but enough to debug programs in Python.
It works in the terminal and by the “h” command, the list of available commands with brief descriptions appears.
- ipdb
Colorful debugging with running the following command:
python -m ipdb test.py
Or calling from inside the Python code by:
import ipdb
breakpoint()
The commands are similar to pdb.
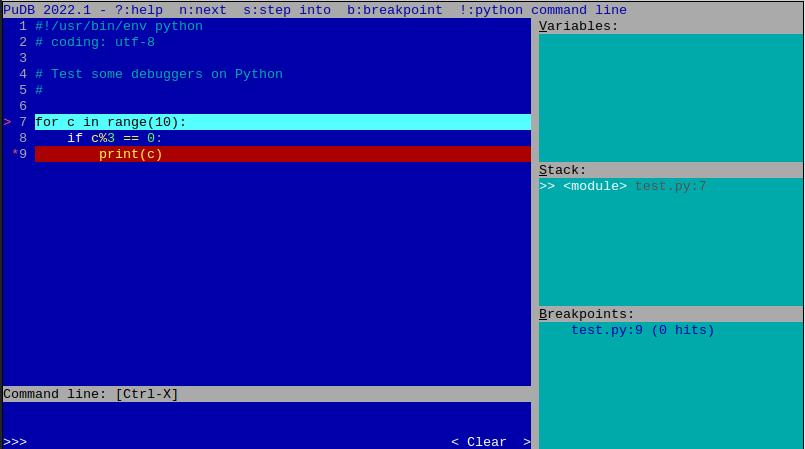
- PuDB
This is a graphical debugger that runs in the terminal. The graphical feature makes it attractive and the usage is very similar to ipdb.
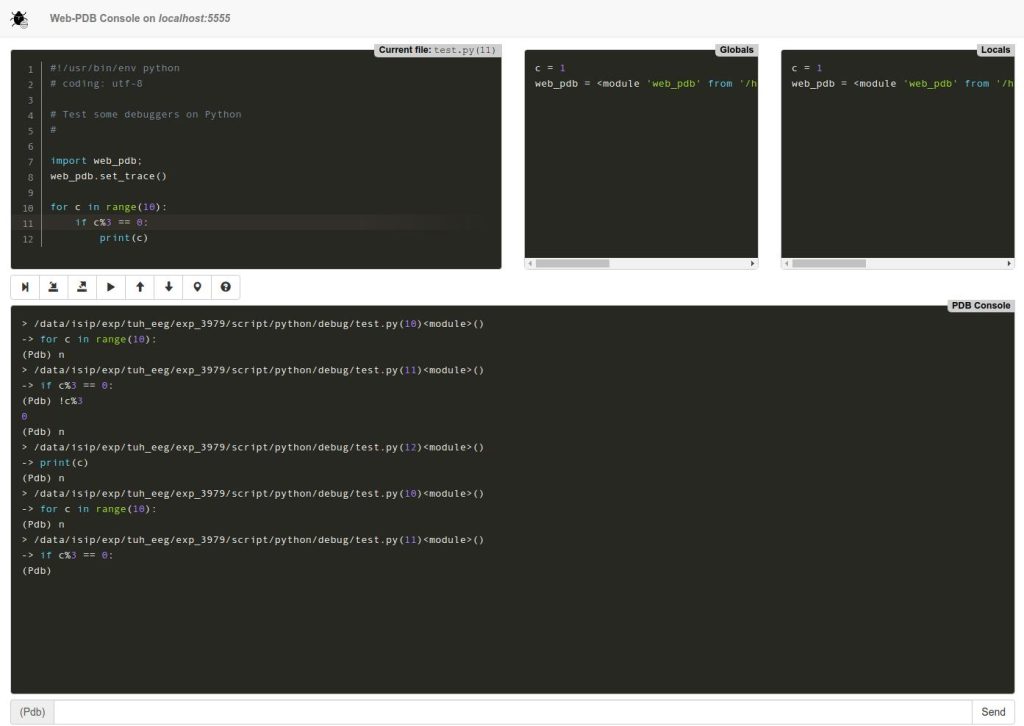
- web-pdb
As the name shows, it works in the browser. The URL of localhost:5555 is used which can be redirected via ssh with the following command:
ssh -X username@server -L 5555:localhost:5555At the top of the program, the following commands should be inserted:
import web_pdb
web_pdb.set_trace()
Or changing the environment variable as PYTHONBREAKPOINT=”web_pdb.set_trace” and then calling the breakpoint() command.
Then the debugger can be opened in the web browser.
Be First to Comment