Introduction
Tool Address: https://uflyy.github.io/green-hotels/
How to Use This Dashboard
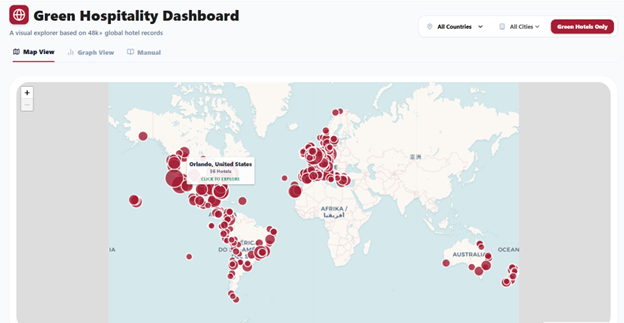
- Global Map Aggregation: At the global or country level, cities are represented by aggregated markers scaled by hotel volume. Click a city marker to seamlessly zoom in and load individual hotel properties without clutter.
- Dynamic Popups: Popups intelligently pan into the view to ensure long lists of Green Features or Hotel Styles are never clipped by the screen edges.
- Deep-Dive Graphing: Navigate to the Graph View to instantly evaluate structural differences across subgroups using Native Boxplots (min, Q1, median, Q3, max), Standardized Radar Profiling, and 100% Stacked Bar Charts.
- Top 10 Feature Slicing: When grouping by specific environmental practices (Green Features), the system automatically filters for the top 10 most adopted measures to preserve visual clarity.