Meta-Analysis
Recommendation
- Article
- Global
- Meta-analysis
Nam, Yoonyoung; Yang, Yang
- Article
- Global
- Meta-analysis
So, Kevin Kam Fung; Yang, Yang; Li, Xiang (Robert)
- Article
- Global
- Meta-analysis
Liu-Lastres, Bingjie; Yang, Yang; Zhang, Carol X.
Related Presentations
- Presentation
- 09/16/2025
Meta-Analysis in Tourism Economics
Tourism Economics in Focus, The IATE Research Seminar Series
Online
- Invited Talk
- 12/18/2024
Meta-analysis of meta-Analyses in tourism and hospitality management
The Hong Kong Polytechnic University
Hong Kong
Related Resources
- Tool
Extended MASEM Analysis from SO, YANG AND LI (2025)
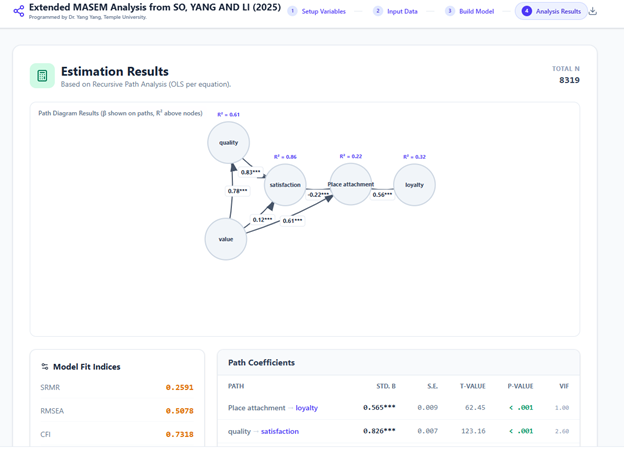
This web-based application is designed to conduct Meta-Analytic Structural Equation Modeling (MASEM). It is built upon the foundational research of So, Yang, and Li (2025), which synthesized 15 years of research to determine the interrelationships between Customer Loyalty, Customer Satisfaction, Perceived Value, and Perceived Service Quality.
Key Features:
- Replication: Users can replicate the findings of So, Yang, and Li (2025) using pre-loaded, industry-specific data.
- Extension: The tool allows researchers to expand the original model by adding new variables (e.g., Place Attachment, Trust, Brand Image) to test novel theoretical frameworks.
- Methodology: It utilizes the Harmonic Mean or Minimal N methods to aggregate sample sizes.
- Tool
MASEM of Risk Perception and Travel Behavior
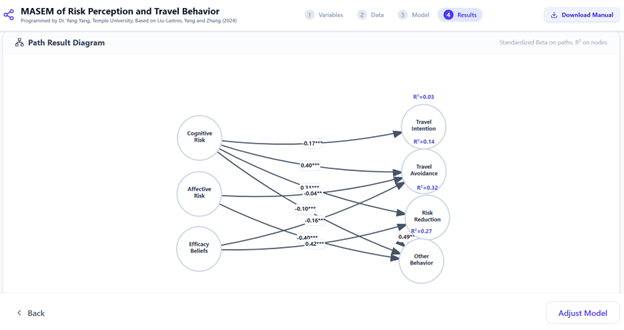
This web-based application is designed to conduct Meta-Analytic Structural Equation Modeling (MASEM) within the context of tourism risk perception. It is built upon the research of Liu-Lastres, Yang, and Zhang (2024), which synthesized findings from 108 articles to identify the optimal model explaining the relationships between tourists’ risk perceptions and behavioral outcomes during a pandemic.
Key Features:
- Replication: Users can replicate the testing of the 8 competing models (Model 1–8) proposed in the original paper (and beyond).
- Flexibility: The tool allows users to hide/restore specific variables to test simplified models or focus on specific relationships.
- Model Comparison: Users can save multiple model configurations and compare their Goodness-of-Fit indices (e.g., AIC, BIC, CFI) in a consolidated table to identify the best-fitting model.
- Visualization: Provides an interactive path diagram with auto-layout features (separating perception variables from outcome variables).

You must be logged in to post a comment.