Tourist Flows and Location
Recommendation
Book Chapter:
- Article
- China
- Spatial Modeling
Liu, Fajian; Guo, Zongkun; Xie, Zhenzhen; Chen, Dongdong; Yang, Yang
- Article
- US
- Econometrics
Nam, Yoonyoung; Yang, Yang
- Book/Chapter
- Global
- Econometrics
Mao, Zhenxing and Yang, Yang
Related Presentations
- Presentation
- 01/02/2025
Spatial Analytics
Workshop on Informatics, Data Science, and Economics in Hospitality and Tourism Research
University of Houston, Houston, TX
- Invited Talk
- 03/04/2024
COVID19tourism Index and its application in tourism management
University of Perpignan
Perpignan, France
Related Resources
- Tool
Bike sharing and tourism impact tool
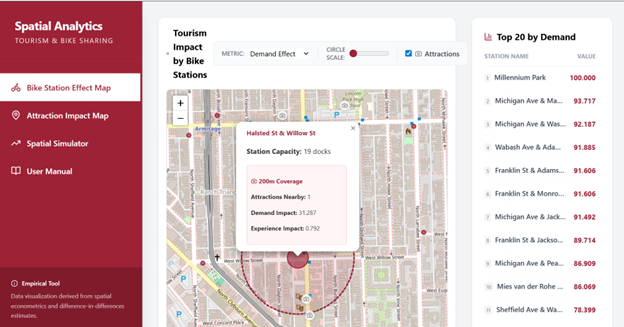
Tool link: https://uflyy.github.io/bike-sharing/
The tool is an interactive, data-driven dashboard designed to visualize the synergistic relationship between urban micro-mobility and tourism. Grounded in empirical econometric research, the tool uses Chicago as a case study to demonstrate how bike-sharing systems impact the demand and visitor experience of nearby tourist attractions. It features interactive spatial mapping and a predictive policy simulator, bridging the gap between academic research and smart city tourism management.
- Tool
Global Tourism Flows
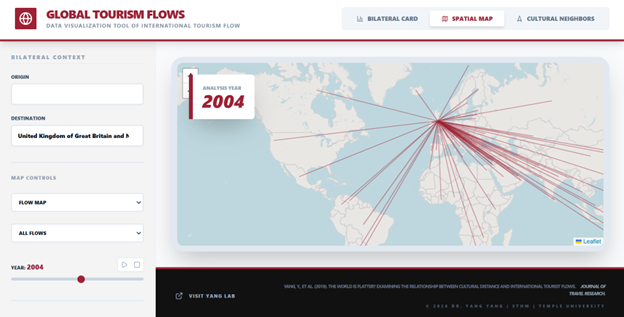
Tool link: https://uflyy.github.io/global-tourism-flow/
This interactive analytical platform serves as a high-fidelity visualization tool for examining the complex dynamics of global tourism flows. The tool allows researchers and practitioners to explore bilateral tourism interactions through both spatial flow maps and regional intensity choropleths. At its core, the system quantifies “World Flatness” by calculating the elasticity of cultural distance, incorporating Hofstede, World Values Survey, and Schwartz frameworks, to demonstrate how technological and economic globalization have mitigated historical barriers to international travel. Users can simulate temporal shifts, analyze geographic friction, and identify proximal cultural markets, transforming abstract statistical data into an intuitive, evidence-based dashboard for strategic tourism intelligence.
- Dataset
Government Attention to Tourism Data
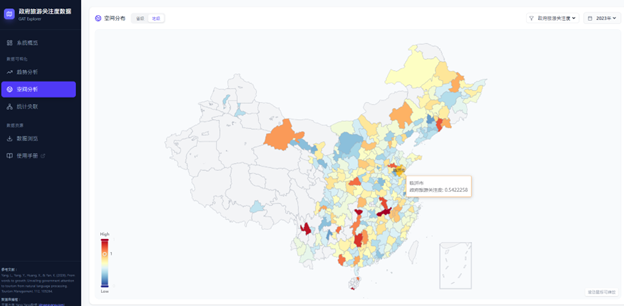
This web-based application is designed to provide researchers and policymakers with an interactive platform for querying and analyzing data regarding Government Attention to Tourism (GAT) in China.
Based on the research findings of Yang, Yang, Huang & Yan (2026), this tool visually demonstrates the spatiotemporal relationships and statistical correlations between the GAT index and various tourism economic indicators. This tool supports a bilingual interface in both Chinese and English. You can switch between the two language modes in real-time by clicking the language toggle button (中文/EN) located in the top-right corner of the page.
Key Features:
Multidimensional Data Coverage: Includes GAT indices and 11 key tourism economic indicators at both the provincial and prefectural (city) levels.
Interactive Visualization: Provides trend analysis, spatial distribution maps, and statistical correlation scatter plots.
Data Resources: Supports viewing summaries of raw data and downloading data.
Tool Link: https://uflyy.github.io/gat-database/
本网页应用旨在为研究人员和政策制定者提供关于中国政府旅游关注度 (Government Attention to Tourism, GAT) 的交互式数据查询与分析平台。
该工具基于 Yang, Yang, Huang & Yan (2026) 的研究成果,通过可视化手段展示了 GAT 指数与各类旅游经济指标之间的时空关系和统计关联。本工具支持中英文双语界面。点击页面右上角的语言切换按钮(中文/EN),即可在两种语言模式间实时切换。
核心功能:
- 多维数据覆盖: 包含省级和地级层面的 GAT 指数及 11 项关键旅游经济指标。
- 交互式可视化: 提供趋势分析、空间分布地图和统计关联散点图。
- 数据资源: 支持查看原始数据摘要及下载。

You must be logged in to post a comment.