Big Data
Recommendation
- Article
- Global
- Survey and Experiment, Big Data
Lee, Eunji; Yang, Yang
- Article
- US
- Econometrics, Big Data
Yang, Yang; Tan, Karen Pei-Sze; Liu, Yi Vanessa
- Article
- China
- Econometrics, Big Data
Yang, Lisi; Yang, Yang; Huang, Xijia; Yan, Kai
Related Presentations
- Presentation
- 01/02/2025
Spatial Analytics
Workshop on Informatics, Data Science, and Economics in Hospitality and Tourism Research
University of Houston, Houston, TX
- Invited Talk
- 03/04/2024
COVID19tourism Index and its application in tourism management
University of Perpignan
Perpignan, France
- Invited Talk
- 03/08/2023
Machine Learning and Artificial Intelligence Research in Tourism and Hospitality
University of Macau
Macau (Online)
- Invited Talk
- 09/17/2021
Tourist behavior analysis using online user generated data
Kyung Hee University
Seoul, Korea (Online)
Related Resources
- Tool
Bike sharing and tourism impact tool
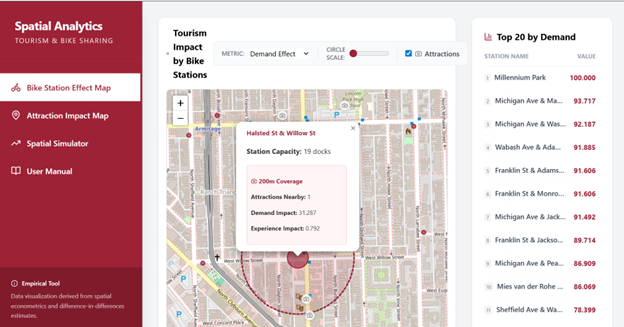
Tool link: https://uflyy.github.io/bike-sharing/
The tool is an interactive, data-driven dashboard designed to visualize the synergistic relationship between urban micro-mobility and tourism. Grounded in empirical econometric research, the tool uses Chicago as a case study to demonstrate how bike-sharing systems impact the demand and visitor experience of nearby tourist attractions. It features interactive spatial mapping and a predictive policy simulator, bridging the gap between academic research and smart city tourism management.
- Tool
Rating Adjustment Tool
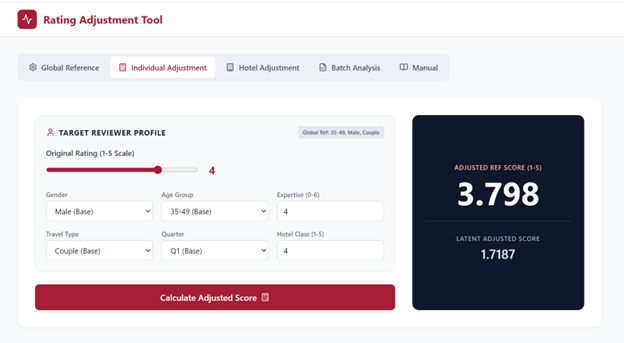
Tool link: https://uflyy.github.io/rating-adjustment/
The Rating Adjustment Tool is an advanced analytical web application designed to standardize hotel online reviews by correcting for “scaling heterogeneity”—the phenomenon where different types of reviewers interpret and use rating scales differently. Powered by a Hierarchical Ordered Probit (HOPIT) model grounded in peer-reviewed academic research , the tool mathematically controls for systematic response biases tied to traveler demographics (such as age and gender) and trip characteristics (such as travel type and reviewer expertise). By offering individual review adjustments, hotel-level aggregate score calculations, and batch CSV processing, the tool effectively translates subjective, raw user ratings into objective, comparable latent scores and standardized 1–5 metrics, ensuring fairer and more accurate hotel evaluations.
This rating adjustment tool is built on the theoretical framework and empirical results from the following paper:
Leung, X. Y., & Yang, Y. (2020). Are all five points equal? Scaling heterogeneity in hotel online ratings. International Journal of Hospitality Management, 88, 102539.
- Tool
Green Hospitality Dashboard
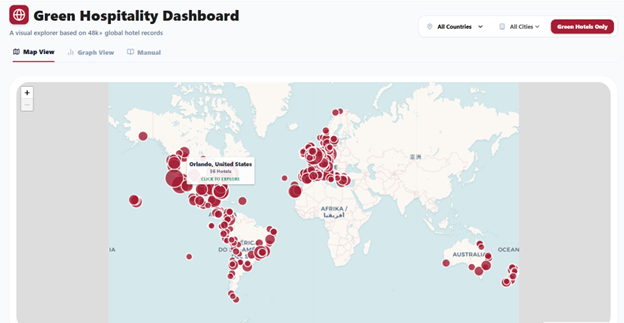
Tool Address: https://uflyy.github.io/green-hotels/
How to Use This Dashboard
- Global Map Aggregation: At the global or country level, cities are represented by aggregated markers scaled by hotel volume. Click a city marker to seamlessly zoom in and load individual hotel properties without clutter.
- Dynamic Popups: Popups intelligently pan into the view to ensure long lists of Green Features or Hotel Styles are never clipped by the screen edges.
- Deep-Dive Graphing: Navigate to the Graph View to instantly evaluate structural differences across subgroups using Native Boxplots (min, Q1, median, Q3, max), Standardized Radar Profiling, and 100% Stacked Bar Charts.
- Top 10 Feature Slicing: When grouping by specific environmental practices (Green Features), the system automatically filters for the top 10 most adopted measures to preserve visual clarity.

You must be logged in to post a comment.