
In Damned Lies and Statistics, Joel Best argues that consumers of statistics need to especially scrutinize international comparisons because there are so many opportunities to mix up apples and oranges (I have discussed this with regard to the conceptual definitions used to quantify police-related deaths in different countries). One of Best’s examples was international comparisons of test scores; he pointed out that sampling strategies used vary across countries and often countries’ performance levels could be chalked up to the broadness of their sampling strategy. In particular, countries with comprehensive secondary school systems (like the United States, where all, or nearly all, adolescents are exposed to an academic-focused curriculum) would sample from the entire population of schools, while countries with “streaming” systems (like in Germany), where some adolescents go to academic high schools while others go to more vocationally-oriented schools, would sample from the academic high schools only. This would stack the deck against countries like the United States.
Damned Lies and Statistics came out in 2001, and the international testing comparisons Best talked about have been supplanted by the Programme for International Student Achievement (PISA), run by the OECD. When I teach Best in my statistics class, I show students the general sampling strategy of PISA:
The desired base PISA target population in each country consisted of 15-year-old students attending educational institutions located within the country. This meant that countries were to include (i) 15-year-olds enrolled full-time in educational institutions, (ii) 15-year-olds enrolled in educational institutions who attended on only a part-time basis, (iii) students in vocational training types of programmes, or any other related type of educational programmes…
Sure, there were some problems with China, but what you are going to do? Surely PISA must be good for comparing democratic countries, right?
Well, no. A team of UCL educational researchers headed by Jake Anders have analyzed the 2015 Canadian sample for PISA and their analysis raises questions about the quality of comparisons involving Canada, which does very well on the PISA in terms of high average scores.
Their article is nice for walking the reader through the sampling strategy of PISA countries.
- First you have to talk about sample exclusions–what part of the population are you trying to generalize to, and what part are you not trying to generalize to? As shown above, PISA is trying to get at 15-year olds in any kind of educational institution. In Canada, that covers 96 percent of 15-year olds so you are dropping 4 percent right off the bat there (the Anders article has a really nice table comparing Canada’s figures to other countries including the United States, where 95% of 15-year-olds are in educational institutions).
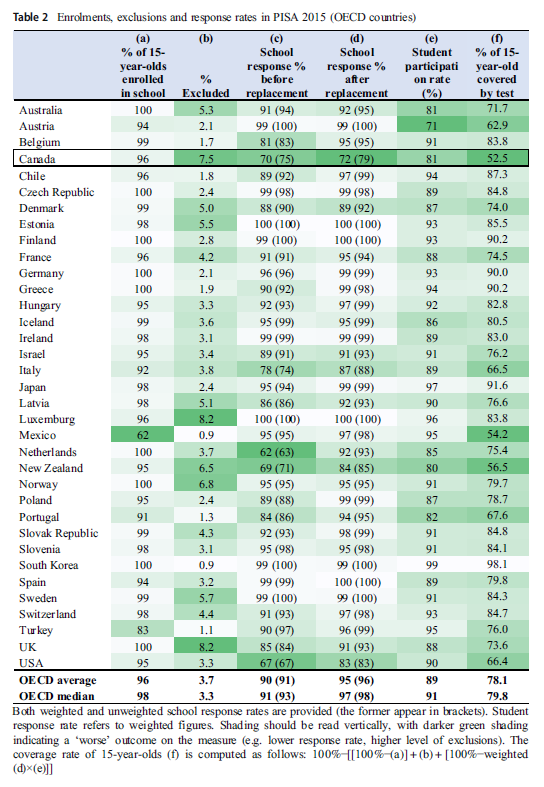
- Not mentioned above is that PISA lets countries exclude students from their target population based on Special Needs (although PISA caps this at 5% of students). In 2015 Canada broached this cap–Anders et al. note that Canada “has one of the highest rates of student exclusions (7.5%).” So now Canada’s sample is supposed to cover 88.8 [96%*(1-.075)] percent of Canadian 15-year olds.
- PISA countries are in charge of their own sampling, and I did not realize how much discretion they have. With nationally representative samples, you really need to do stratified sampling (and probably clustered sampling as well which Anders et al do not get into). Stratified sampling means countries divide schools into strata based on combinations of variables and sample from each of their strata to ensure a representative sample. Countries choose their own stratifying variables (!), and in Canada these are “province, language, and school size” which seems fine to me.
- We have not even talked about school and student non-compliance, and here is where things get really messy. Canada selected 1008 schools to participate in the 2015 PISA, and 30% refused. What countries can do is try to recruit “replacement schools” that are similar to refusing schools based on the stratifying variables as well as another set of variables (which Anders et al. refer to as “implicit” stratifying variables). Canada was able to recruit 23 replacement schools, but it is not clear that the variables Canada used to implicitly stratify schools were that meaningful for test scores–meaning it is possible that the replacement schools are very different from the originally-selected schools in unobserved ways. It is only 2% of the sample but this problem of using meaningless variables to gauge the representativeness of the sample will be an issue.
- Anders et al. points out that at 70%, Canada is fourth-worst among OECD countries in terms of the response rate of initial schools (beaten out by the Netherlands, New Zealand, and USA). In terms of overall response rate (after including the replacement schools) Canada’s 72 is the worst (the US, at 83 percent, still looks very bad relative to other OECD countries, most of which are at 95 percent or above).
- PISA requires countries with low initial response rates between 65% and 85% to do a non-response bias analysis (NRBA). Countries below 65% (like the Netherlands) are supposed to be excluded, but in this case, they were not. PISA does not report the details of these NRBAs, and Anders et al. tracked down Canada’s province-specific NRBAs and found they were pretty superficial, and suffered from the problem of using a handful of variables to show that non-responding schools are similar to responding schools (although in the case of Quebec there were significant differences between refusal and complying schools).
- Now we get into pupil non-response, and again, Canada is among the worse in this regard, with 81% of students in complying schools taking the PISA tests (the other two countries with worse or comparable rates are Austria at 71% and Australia also at 81%). We know that non-participating students tend to do worse on the tests, and one way to get around this is to weigh student participants such that those with characteristics similar to non-participants are weighted more. But again, we get into this issue where Canada uses weights based on variables that do not really matter for test scores (the stratifying variables plus “urbanisation, source of school funding, and [school level]”).
- I am not sure how Anders et al. calculate this, but all told, Canada’s sample is really only representative of 53% of Canadian students (although I wonder if they meant to say 53% of Canadian 15-year olds).
- Anders et al. do some simulations for reading scores, assuming that non-participant students on average would perform worse on the PISA tests than participant students. If we assume that the non-participating students do moderately worse on the PISA instrument (say, at the 40 or 35th percentiles), Canada’s reading scores are still better than average but are not at the “super-star” levels it enjoys with its reported performance. If we assume the non-participants do substantially worse (say, at the 30th percentile) for Canada’s mean PISA reading scores take a serious dive and Canada starts looking more like an average country.
The one thing that really sticks out here–and also with Tom Loveless’s discussion of PISA and China–is that PISA’s behavior is not consistent with the dispassionate collection and analysis of data. They have opened the door to countries (especially wealthy ones) fudging their data and they do not really seem to care.