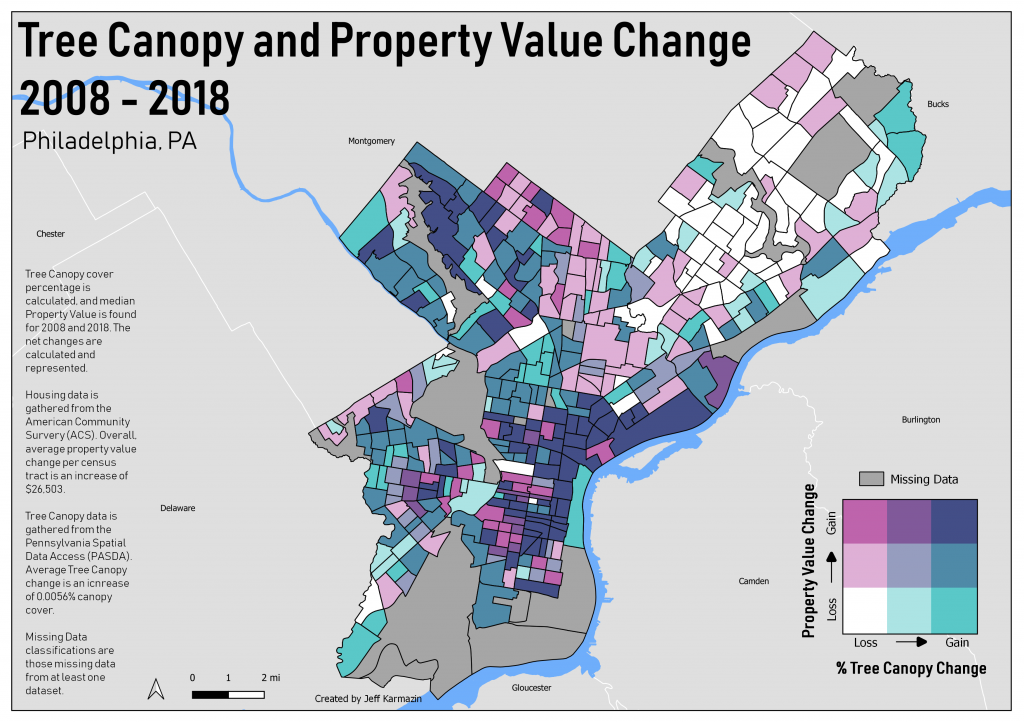
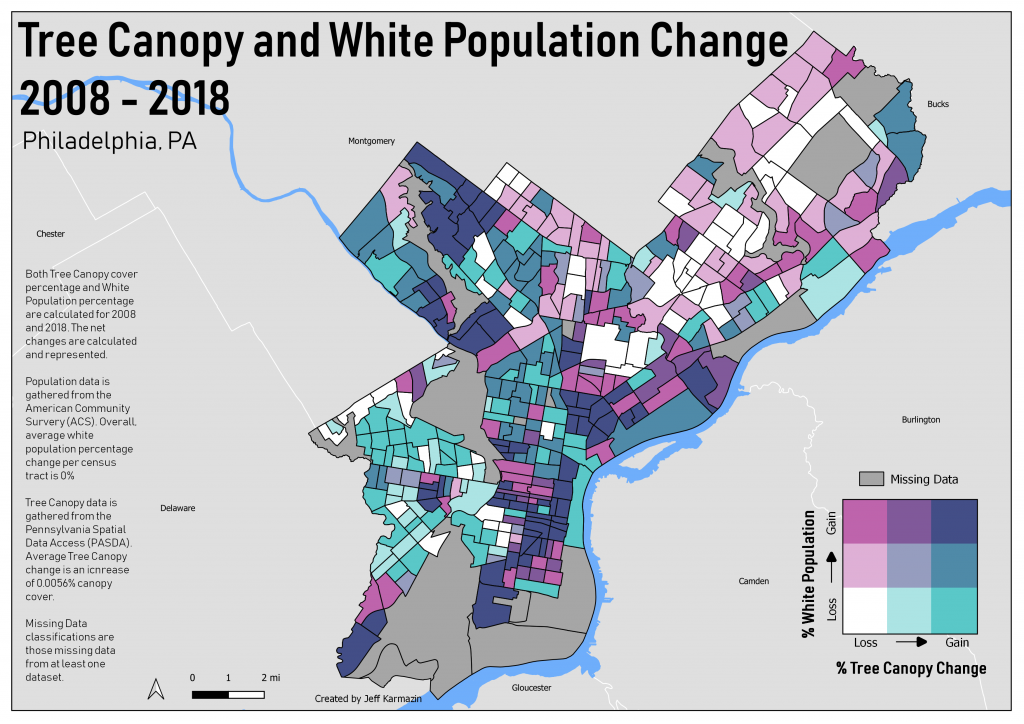
As part of a group project this past semester, my team and I searched to find correlations between a change of tree canopy and socio-economic factors. The hypothesis is that areas that have gentrified or are more desirable would have an increased tree canopy over the 10 year period we investigated.
Tree canopy percentage per census tract was calculated using raster data reclassifications and zonal statistics, both for years 2008 and 2018. Socio-economic data is found from the American Community Survey for years 2008 and 2018. The net changes were found over this 10 year period for tree canopy and socio-economic factors such as property value, race population, rent values, and more.
Overall, Philadelphia county saw a decrease in tree canopy percentage, but many census tracts within the inner-city experience an increase.
I created two bivariate choropleth maps to visualize some neighborhoods that experience increases in both tree canopy and social factors.
Be First to Comment