Please check out my new page that I have created, Please click here to see more!
Leave a CommentJeffrey Karmazin
Please check out my new page that I have created, Please click here to see more!
Leave a CommentThe busy days continue at Metro Commercial Real Estate! I have been very busy with my daily responsibilities, thus resulting in less time than I had planned for my capstone project. However, I have been able to make some progress with my limited availability.
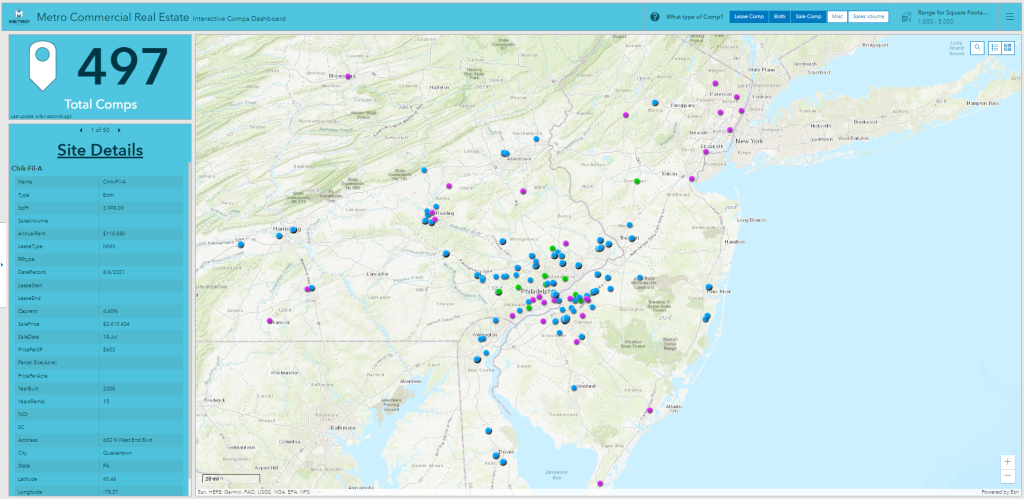
I have created an ArcGIS dashboard for our comps database. The dashboard itself is interactive. The header bar has options to select what type of comps is to be viewed and the user can set a specific range for square footage of the property. The map will automatically load while changing these settings. Also, when zooming in and out, the map with adjust it’s counts / details at the left of the screen. The user can also search for a specific address in the search bar to the upper right. The color scheme matches the branding of Metro Commercial. Even if time does not allow for further development on this dashboard, I feel satisfied with the outcome. The only process moving forward will to be continue to add to the comps database, and upload the new database to the map regularly (monthly or quarterly).
I have not made as much progress as I would have hoped by now on my previously discussed comps database project. I have gone through the database and cleaned it up a bit. There were many repeats and many sites without full information, so I went through and attempted to plug in as much missing information as I could.
We have been extremely busy since the start of the new year. My coworkers tell me this is the busiest they have seen it in their time here at Metro. This is the main reason I have not been able to focus on the comps project as much as I had hoped. However, my daily workload as been enormous with project after project.
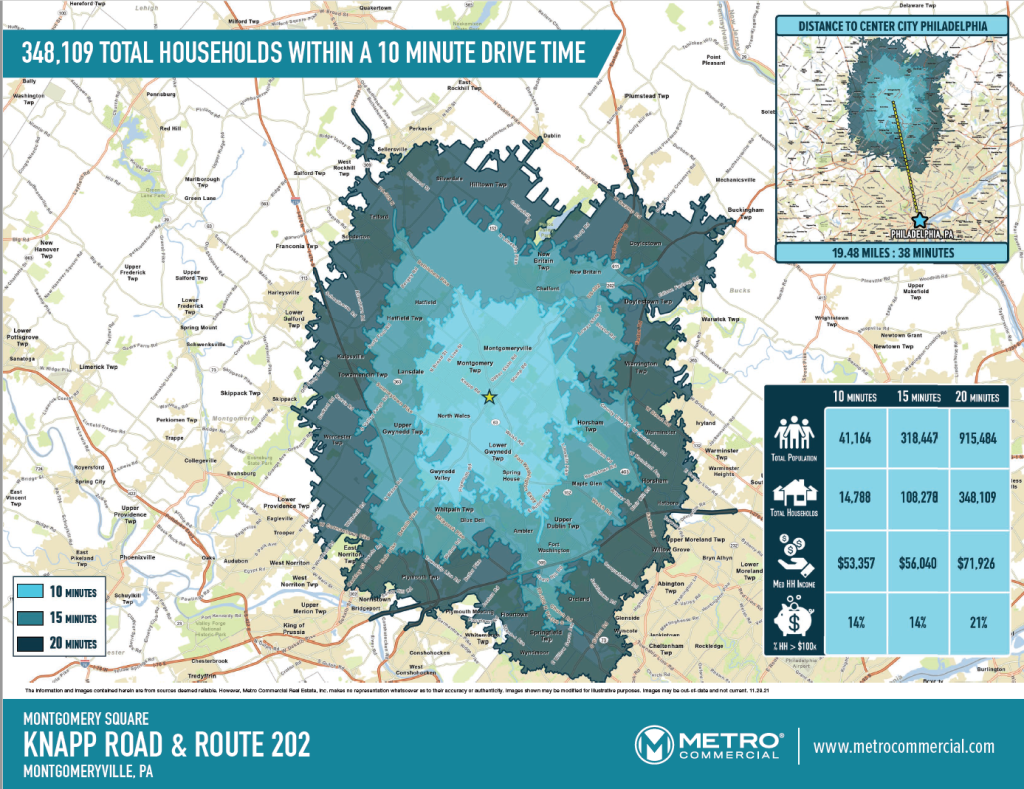
I was involved in the recent process of updating our standard brochure template. I will attach a screen shot or example. However, I did update the visualization of the map, with new data tables, icons, etc. As I have not had much time to focus on the comps database, I have been involved in improving other aspects here at Metro.
I have recently begun my final course to complete to receive my Master’s degree in GIS. There were a number of projects that I thought to focus on while at my role as GIS Analyst at Metro Commercial Real Estate. On top of my day to day responsibilities, I have a few additional projects that I have directed extra energy. I have been involved in changing the map component for our standard brochure, experimented with ESRI’s interactive HTML, and a few other smaller projects.
The large project that I am putting majority of my spare time towards is revitalizing the sales and lease comparisons (comps) database that is utilized by my team and brokers at Metro Commercial. This database contains sales and lease comparisons of commercial properties from competing real estate firms. The dataset contains various information including sales volume, sale price, rent price, rent type, square footage, parcel acreage, address, lease terms, and more. Currently, the comps database has over 1,500 entries which have been built up over the past few years. We collect the comps entries based on what brokers provide us. There are a number of issues with the comps database, mainly that many entries are incomplete and inconsistent.
The issue of being incomplete is inevitable, as often times brokers are sending whatever they can find to aid themselves in the future. The inconsistency comes from the turnover of analysts over the past few years. For example, the rental rate section has rates in forms of annually, monthly, per square foot, per sf per year. Many of the addresses are not geocoded, addressed are not complete, and many other inconsistencies.
The largest chunk of this project will be cleaning up the database and getting it to a consistent status. In my next blog post, I will describe my intentions with this database moving forward.
Leave a CommentI have recently began my first professional GIS position. I have taken the role of GIS Analyst at Metro Commercial Real Estate. The position requires majority of the work to be produce in ArcGIS with some Photoshop and Adobe Illustrator. Many of the maps are used for sales and strategy meetings with clients which involve site analysis, trade areas, and creating datasets. There is some work to be done in Google Earth and Placer.ai, an app which I was not very familiar to run consumer reports. Additionally, much of the work utilizes ArcGIS Business Analyst, another package which I was unfamiliar. The biggest adjustment for me in this role comes with the fast turn around for maps. Many maps are needed with fast turnaround, as sales teams and brokers are making adjustments up until the last minute. Overall, I am very excited to get involved and grow in the GIS field!
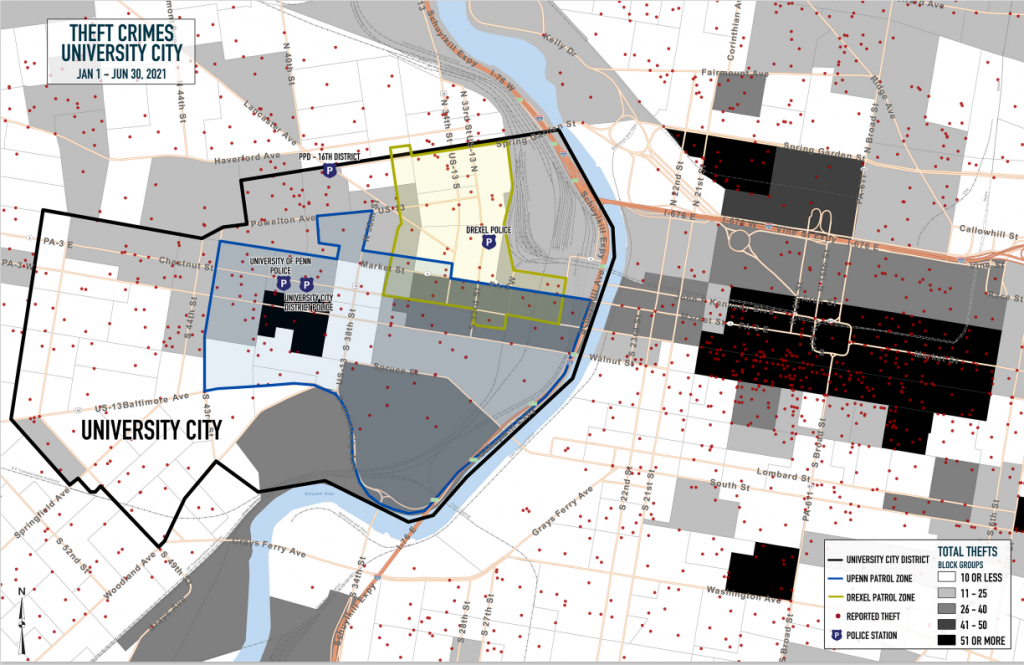
For many of the maps and images that I produce, I am bound by a disclosure agreement. However, I did recently have a small project that used open source data and standard tools found with ArcGIS and QGIS applications. The map below is similar to the original, but protects sensitive data. University City is compared with Center City Philadelphia in regards to thefts reported so far in 2021 (1/1 – 6/30).
As the City of Philadelphia nears the end of its Lincoln Drive Restoration Project, I decided to take a look at the actual car accident data that influenced a restoration in the first place.
Data from the Pennsylvania Department of Transportation was downloaded for years 2016 – 2019. These public data sets were turned into shapefiles and focused into car accidents that occurred within 100 feet of the Lincoln Drive Corridor. The Lincoln Drive Corridor is defined as the entrance to Wissahickon Drive that turns into Lincoln Drive, the Emlen Street connection to North Lincoln Drive and Cresheim Valley Drive.
The shapefiles are represented both as heat maps and point clusters.
In total from 2016 to 2019, 364 car accidents have been reported along this corridor. Three car accident hot spots are highlighted; 1. – Fork at Cresheim Valley Dr, Emlen St, and North Lincoln Dr; 2. – Most eastern curve on Lincoln Dr; 3. – Southern most curver at the entrance to Lincoln Dr.
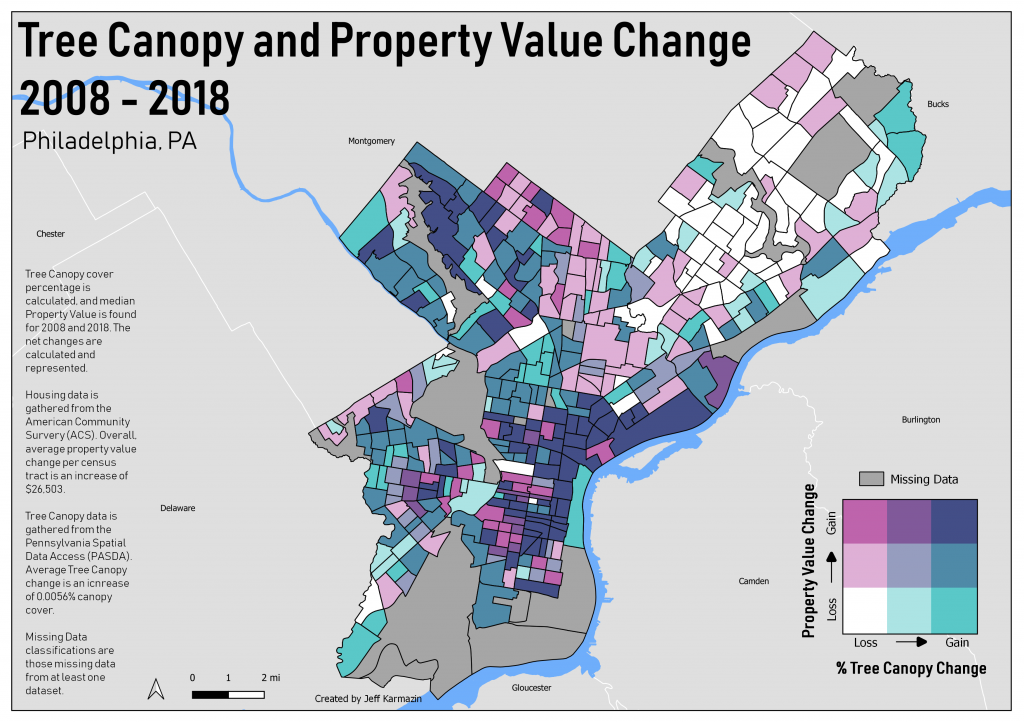
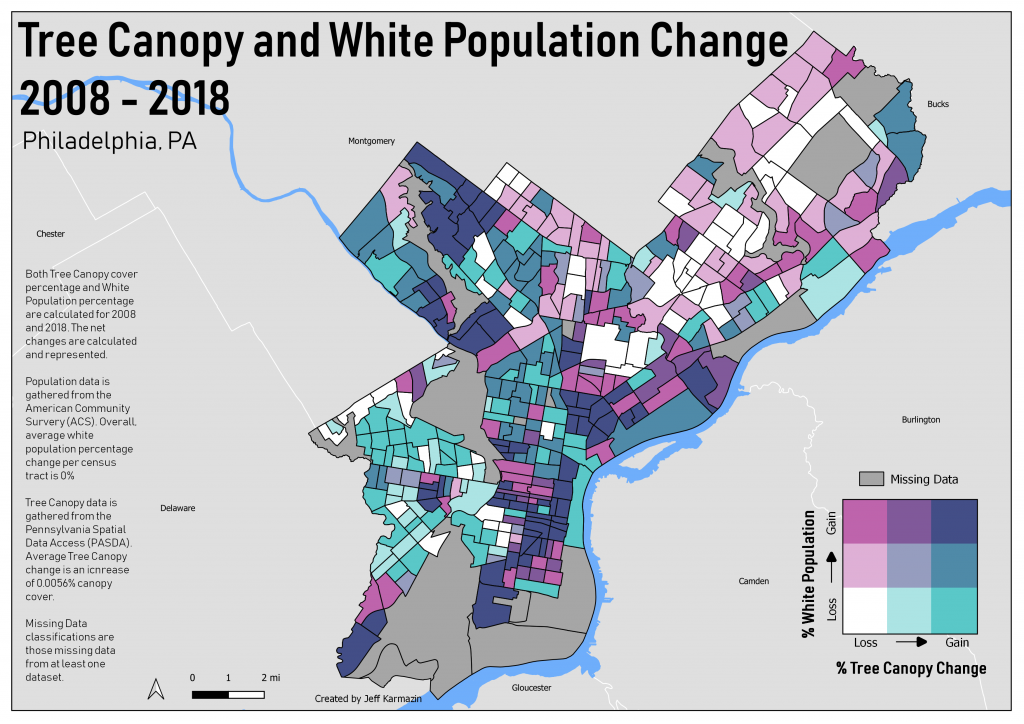
As part of a group project this past semester, my team and I searched to find correlations between a change of tree canopy and socio-economic factors. The hypothesis is that areas that have gentrified or are more desirable would have an increased tree canopy over the 10 year period we investigated.
Tree canopy percentage per census tract was calculated using raster data reclassifications and zonal statistics, both for years 2008 and 2018. Socio-economic data is found from the American Community Survey for years 2008 and 2018. The net changes were found over this 10 year period for tree canopy and socio-economic factors such as property value, race population, rent values, and more.
Overall, Philadelphia county saw a decrease in tree canopy percentage, but many census tracts within the inner-city experience an increase.
I created two bivariate choropleth maps to visualize some neighborhoods that experience increases in both tree canopy and social factors.
Here I am beginning the process of creating my online portfolio. This may take some time as I am finishing up the Fall semester and focusing on final projects. However, let it begin! As soon as my current projects and map design are to an area I am comfortable, I will publish here on my site with descriptions, images, results, and more.
1 Comment