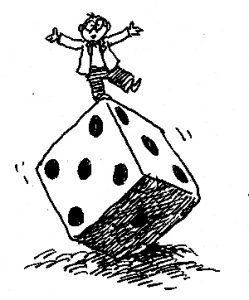
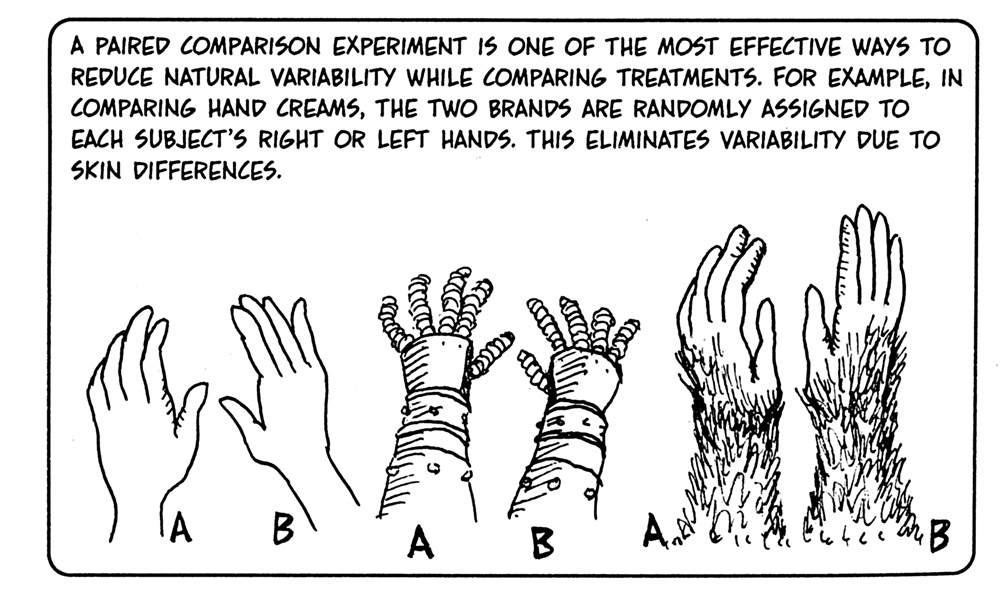
Finding effective ways to communicate basic and advanced statistical ideas and methods is essential, not only for students but also for researchers. I have worked with an ingenious cartoonist, Larry Gonick, to explain basic statistics using cartoons, graphics, mathematics, and bad puns in The Cartoon Guide to Statistics.
from the Cartoon Guide to Statistics, by Larry Gonick and Woollcott Smith
HarperCollins, 1993
In the 1996-1997 and in 2004-2005 academic years I was on study leave from Temple University working as a Senior Fellow in the Marine Policy Center at the Woods Hole Oceanographic Institution. At Woods Hole I worked on statistical problems related to environmental policy including the preservation of species diversity.
My primary interest is in stochastic processes and their application to the biological and engineering sciences. This has led to other research work in probability inequalities, estimation of diversity and similarity measures and density estimation. Many of these ideas have found application in my applied work in environmental regulation and survey design, including the analysis of marine oil spills and the efficient design of environmental surveys.
Another area of my applied research is the interface between instrumentation and statistics, including the design of undersea survey systems, the analysis of digitization error, continuous measurement and automated sorting systems. My research includes work with the Campbell Soup, EPA, Philadelphia Academy of Natural Sciences and the Colombian Coffee Federation.
Just like potholes in the road, there can be potholes in data sets – where there should be data, but it seems to be missing. Data potholes can be hard to find and to visualize: the pothole below is obscured in a fog of 4,000 data points, and its five-dimensional properties must be displayed on a two-dimensional screen. The basic idea is to up-weight the data points in the neighborhood of the hole and then find the “best” two-dimensional projection. (The link to a JSM talk, gives some of the details.)