Using the geographic information systems software ArcGIS, the team geocoded, or spatially located, each of the sold PHA scattered sites on a map of Philadelphia and tied the number of properties sold in each census tract by the year and in aggregate.
View the dynamic map of all sold PHA properties from 2012-2019.
Figure 1: Gentrification model from 2012-2019, with ineligible tracts, compared to PHA scattered-site sales from 2011-2019
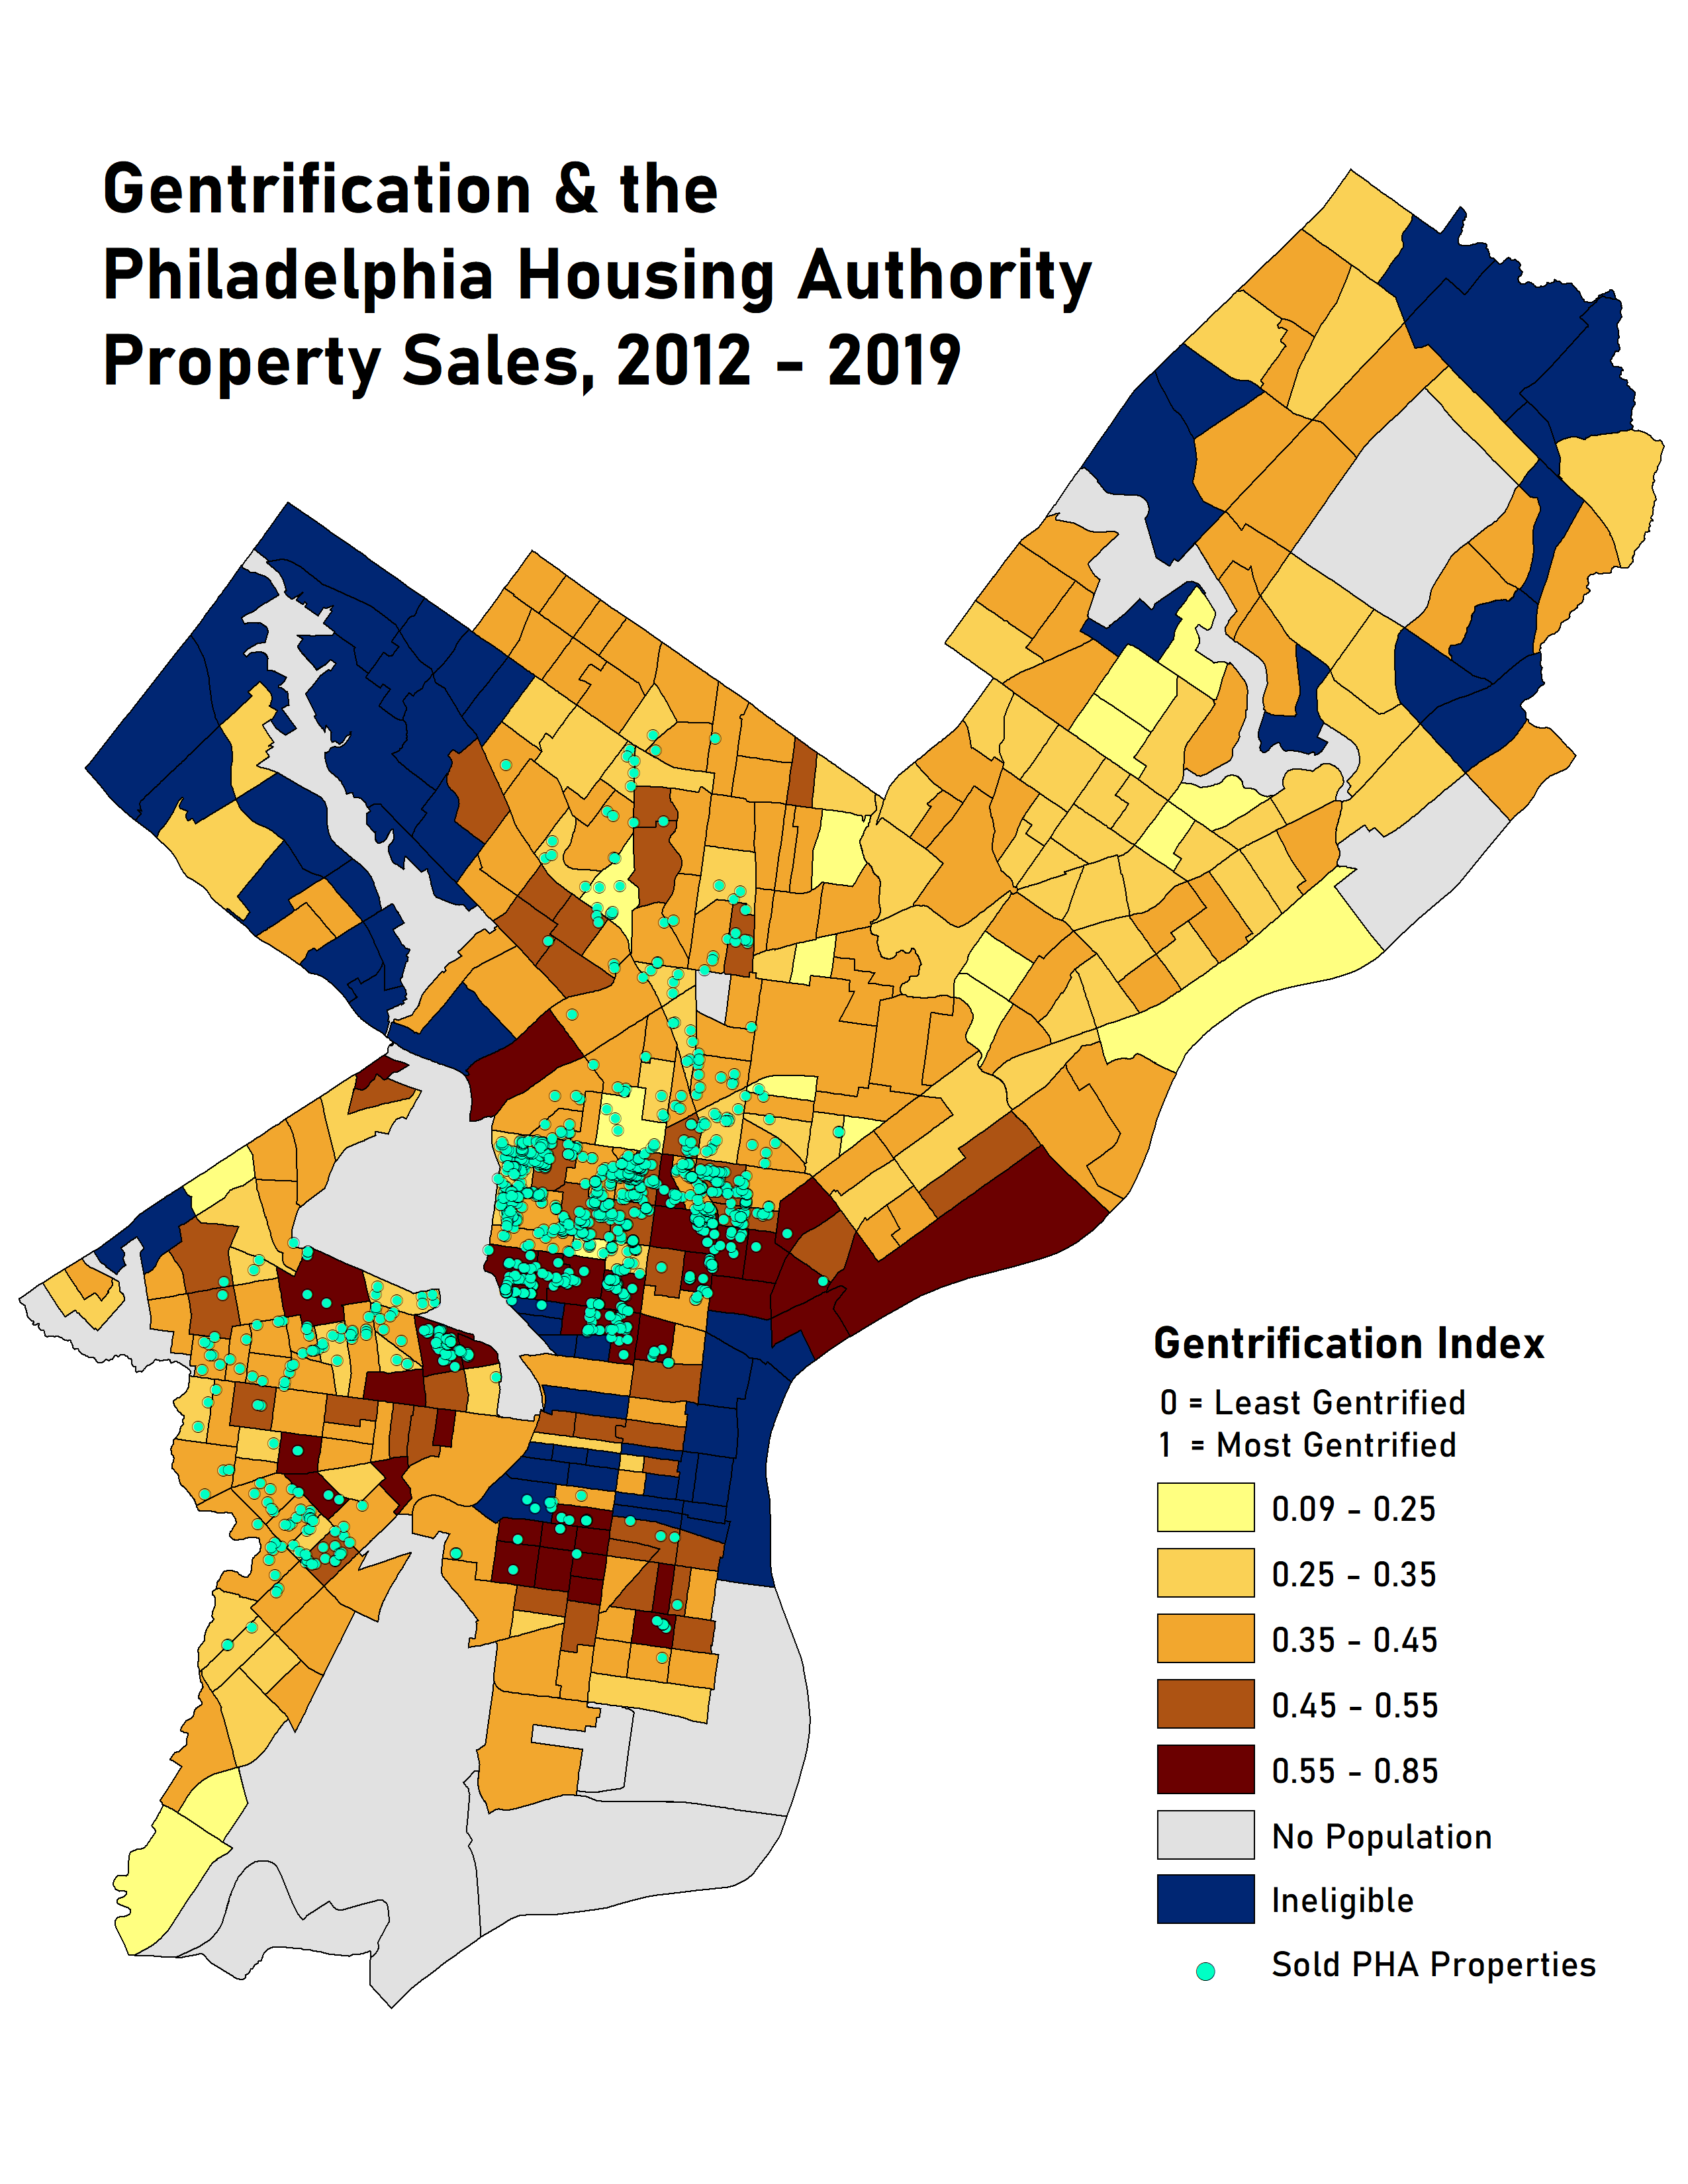
Next, the median household income in 2012 was used to limit previously developed or gentrified census tracts from the analysis. A total of 56 tracts were excluded from the analysis based on an income threshold of greater than $60,000 a year in household income, as these tracts are already developed and ineligible for further gentrification. Eight PHA property sales in these tracts were also excluded. The gentrification index from 2012 – 2019 of the remaining 316 census tracts, combined with the excluded tracts, are mapped alongside the PHA sales from 2011 – 2019 in Figure 1.
‘x’ = PHA sales by tract per 1,000 population, separately by year, and also in aggregate from 2011 – 2019
‘y’ = gentrification index coefficients from 2012 – 2019
2. Gentrification and Demographic Composition Change
‘x’ = gentrification index coefficients from 2012 – 2019, excluding the demographic data
‘y’ = percent change in proportion of White to non-White residents from 2012 – 2019
3. Gentrification and Raw Population Change
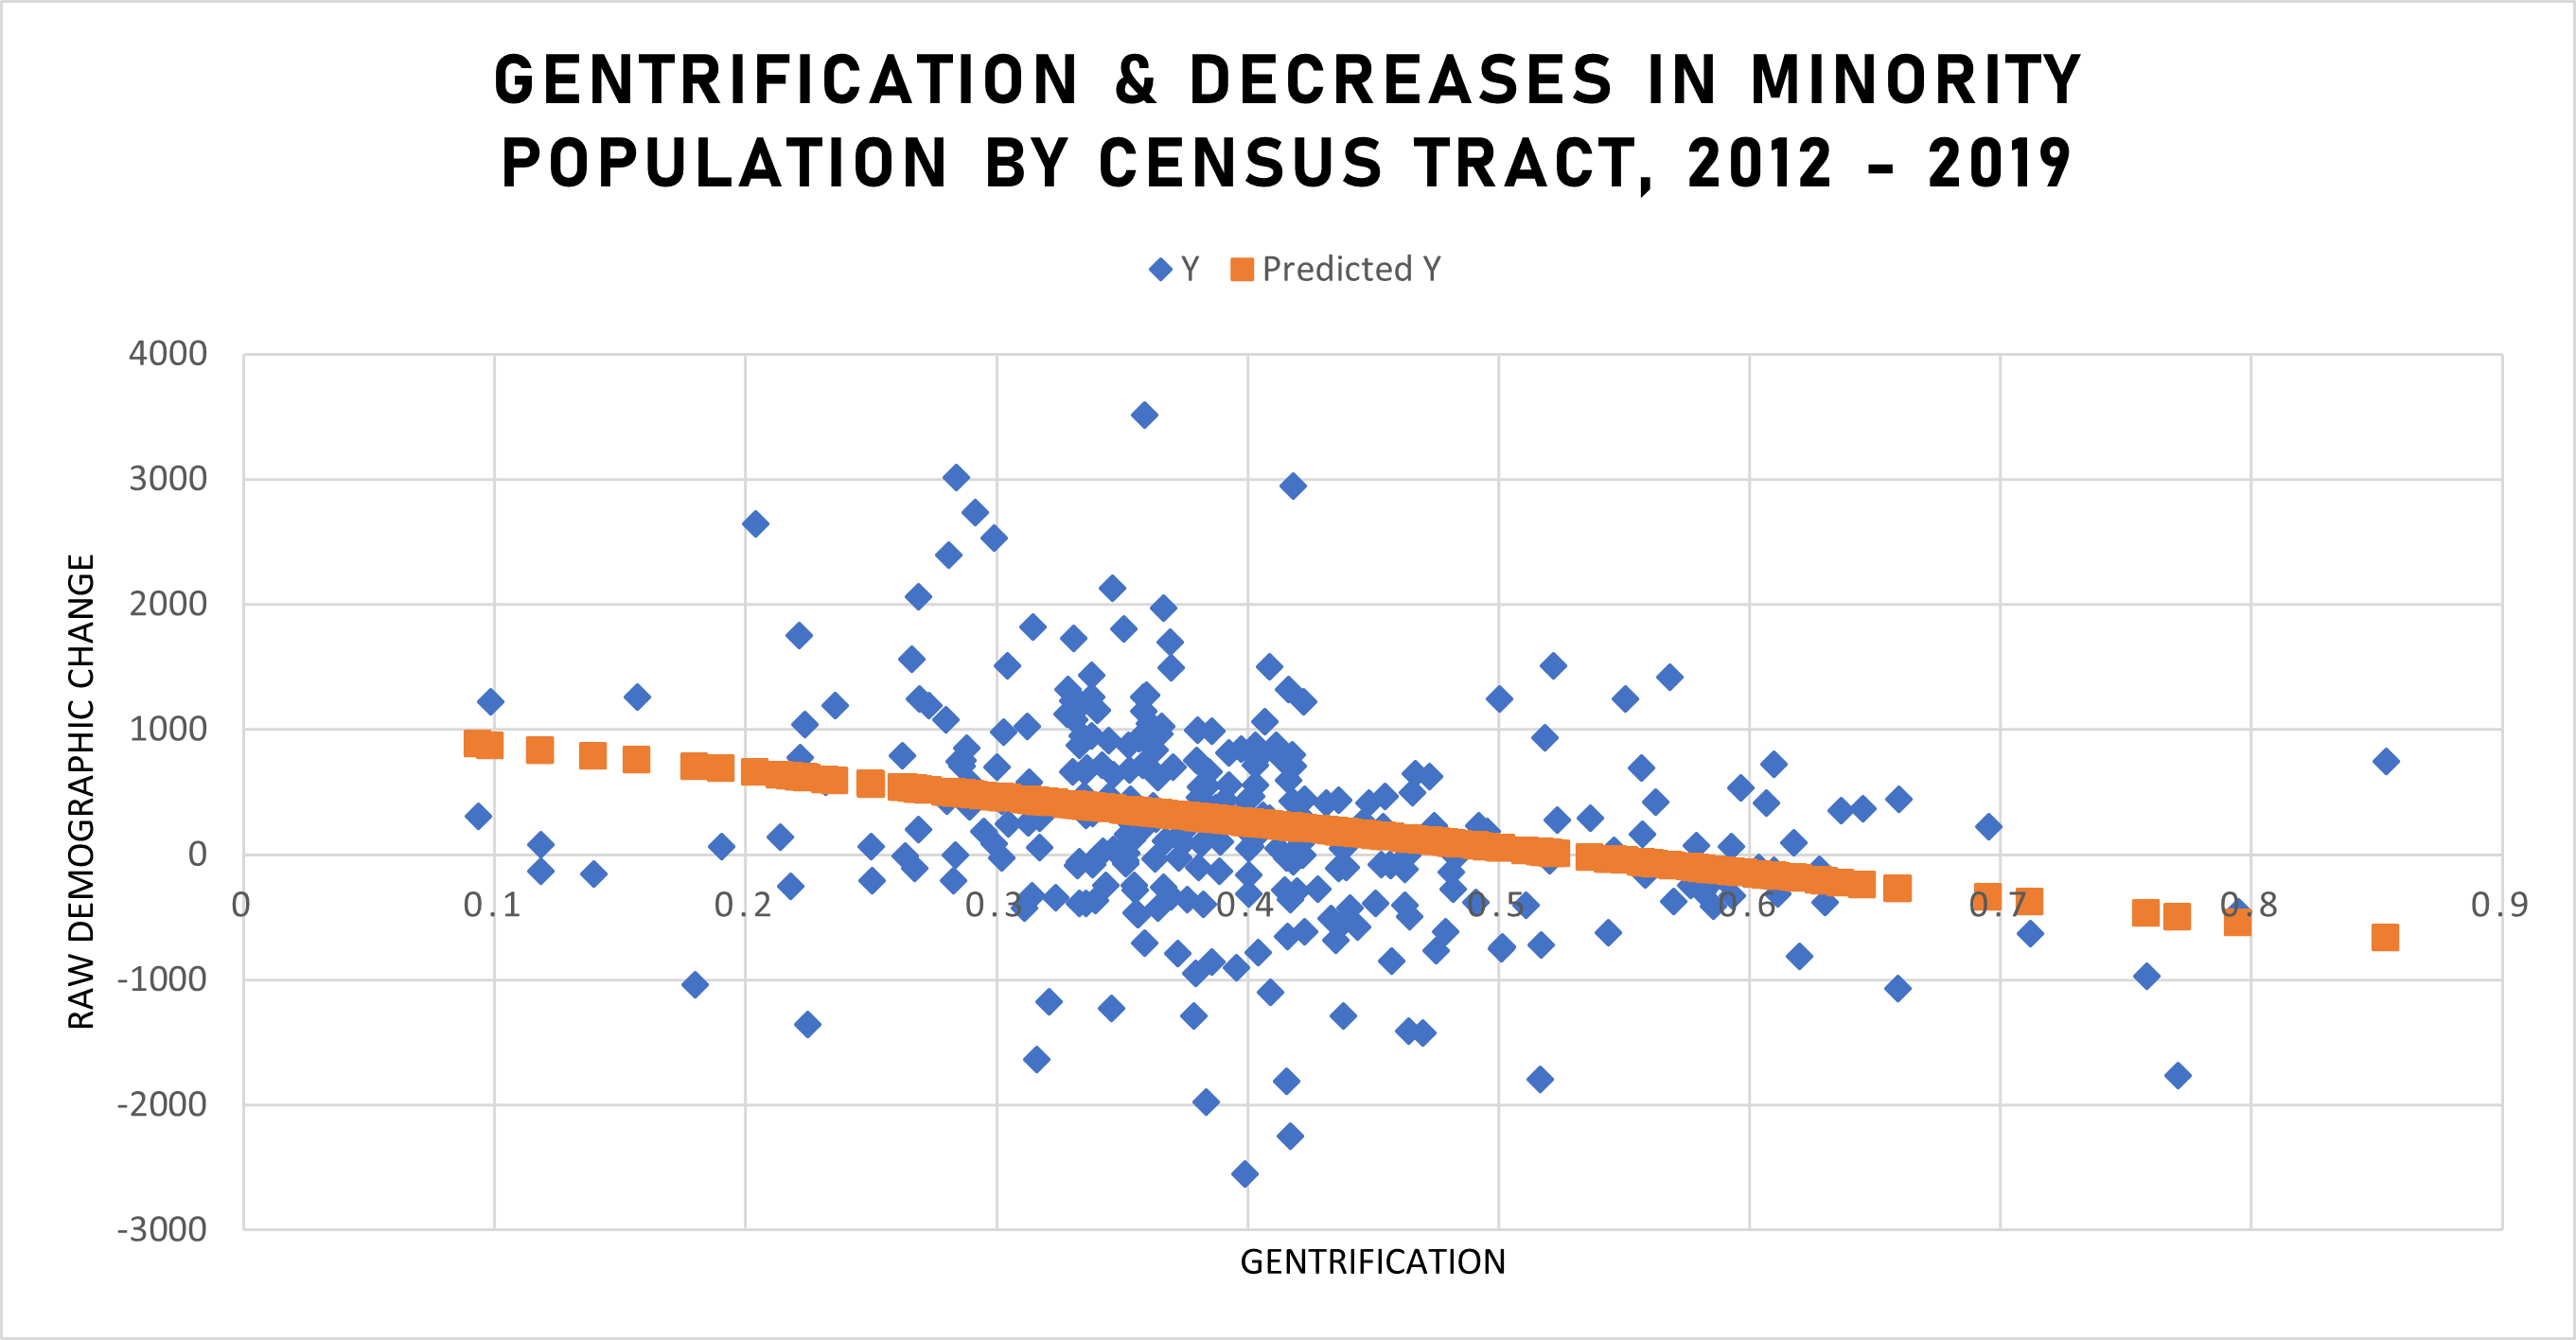
‘x’ = gentrification index coefficients from 2012 – 2019, excluding demographic data
‘y’ = raw population change in non-White residents from 2012 – 2019
The three regression models allowed the research team to answer the three research questions: (1) What is the relationship between gentrification and the sale of PHA scattered sites? (2) Which communities are most affected by gentrification? (3) Is the sale of affordable housing the driving force behind gentrification, or do property sales only play a minor role in reshaping many Philadelphia neighborhoods?
Figure 2: Model #1 depicted on a line graph of gentrification model from 2012-2019, with ineligible tracts, compared to PHA scattered-site sales from 2011-2019
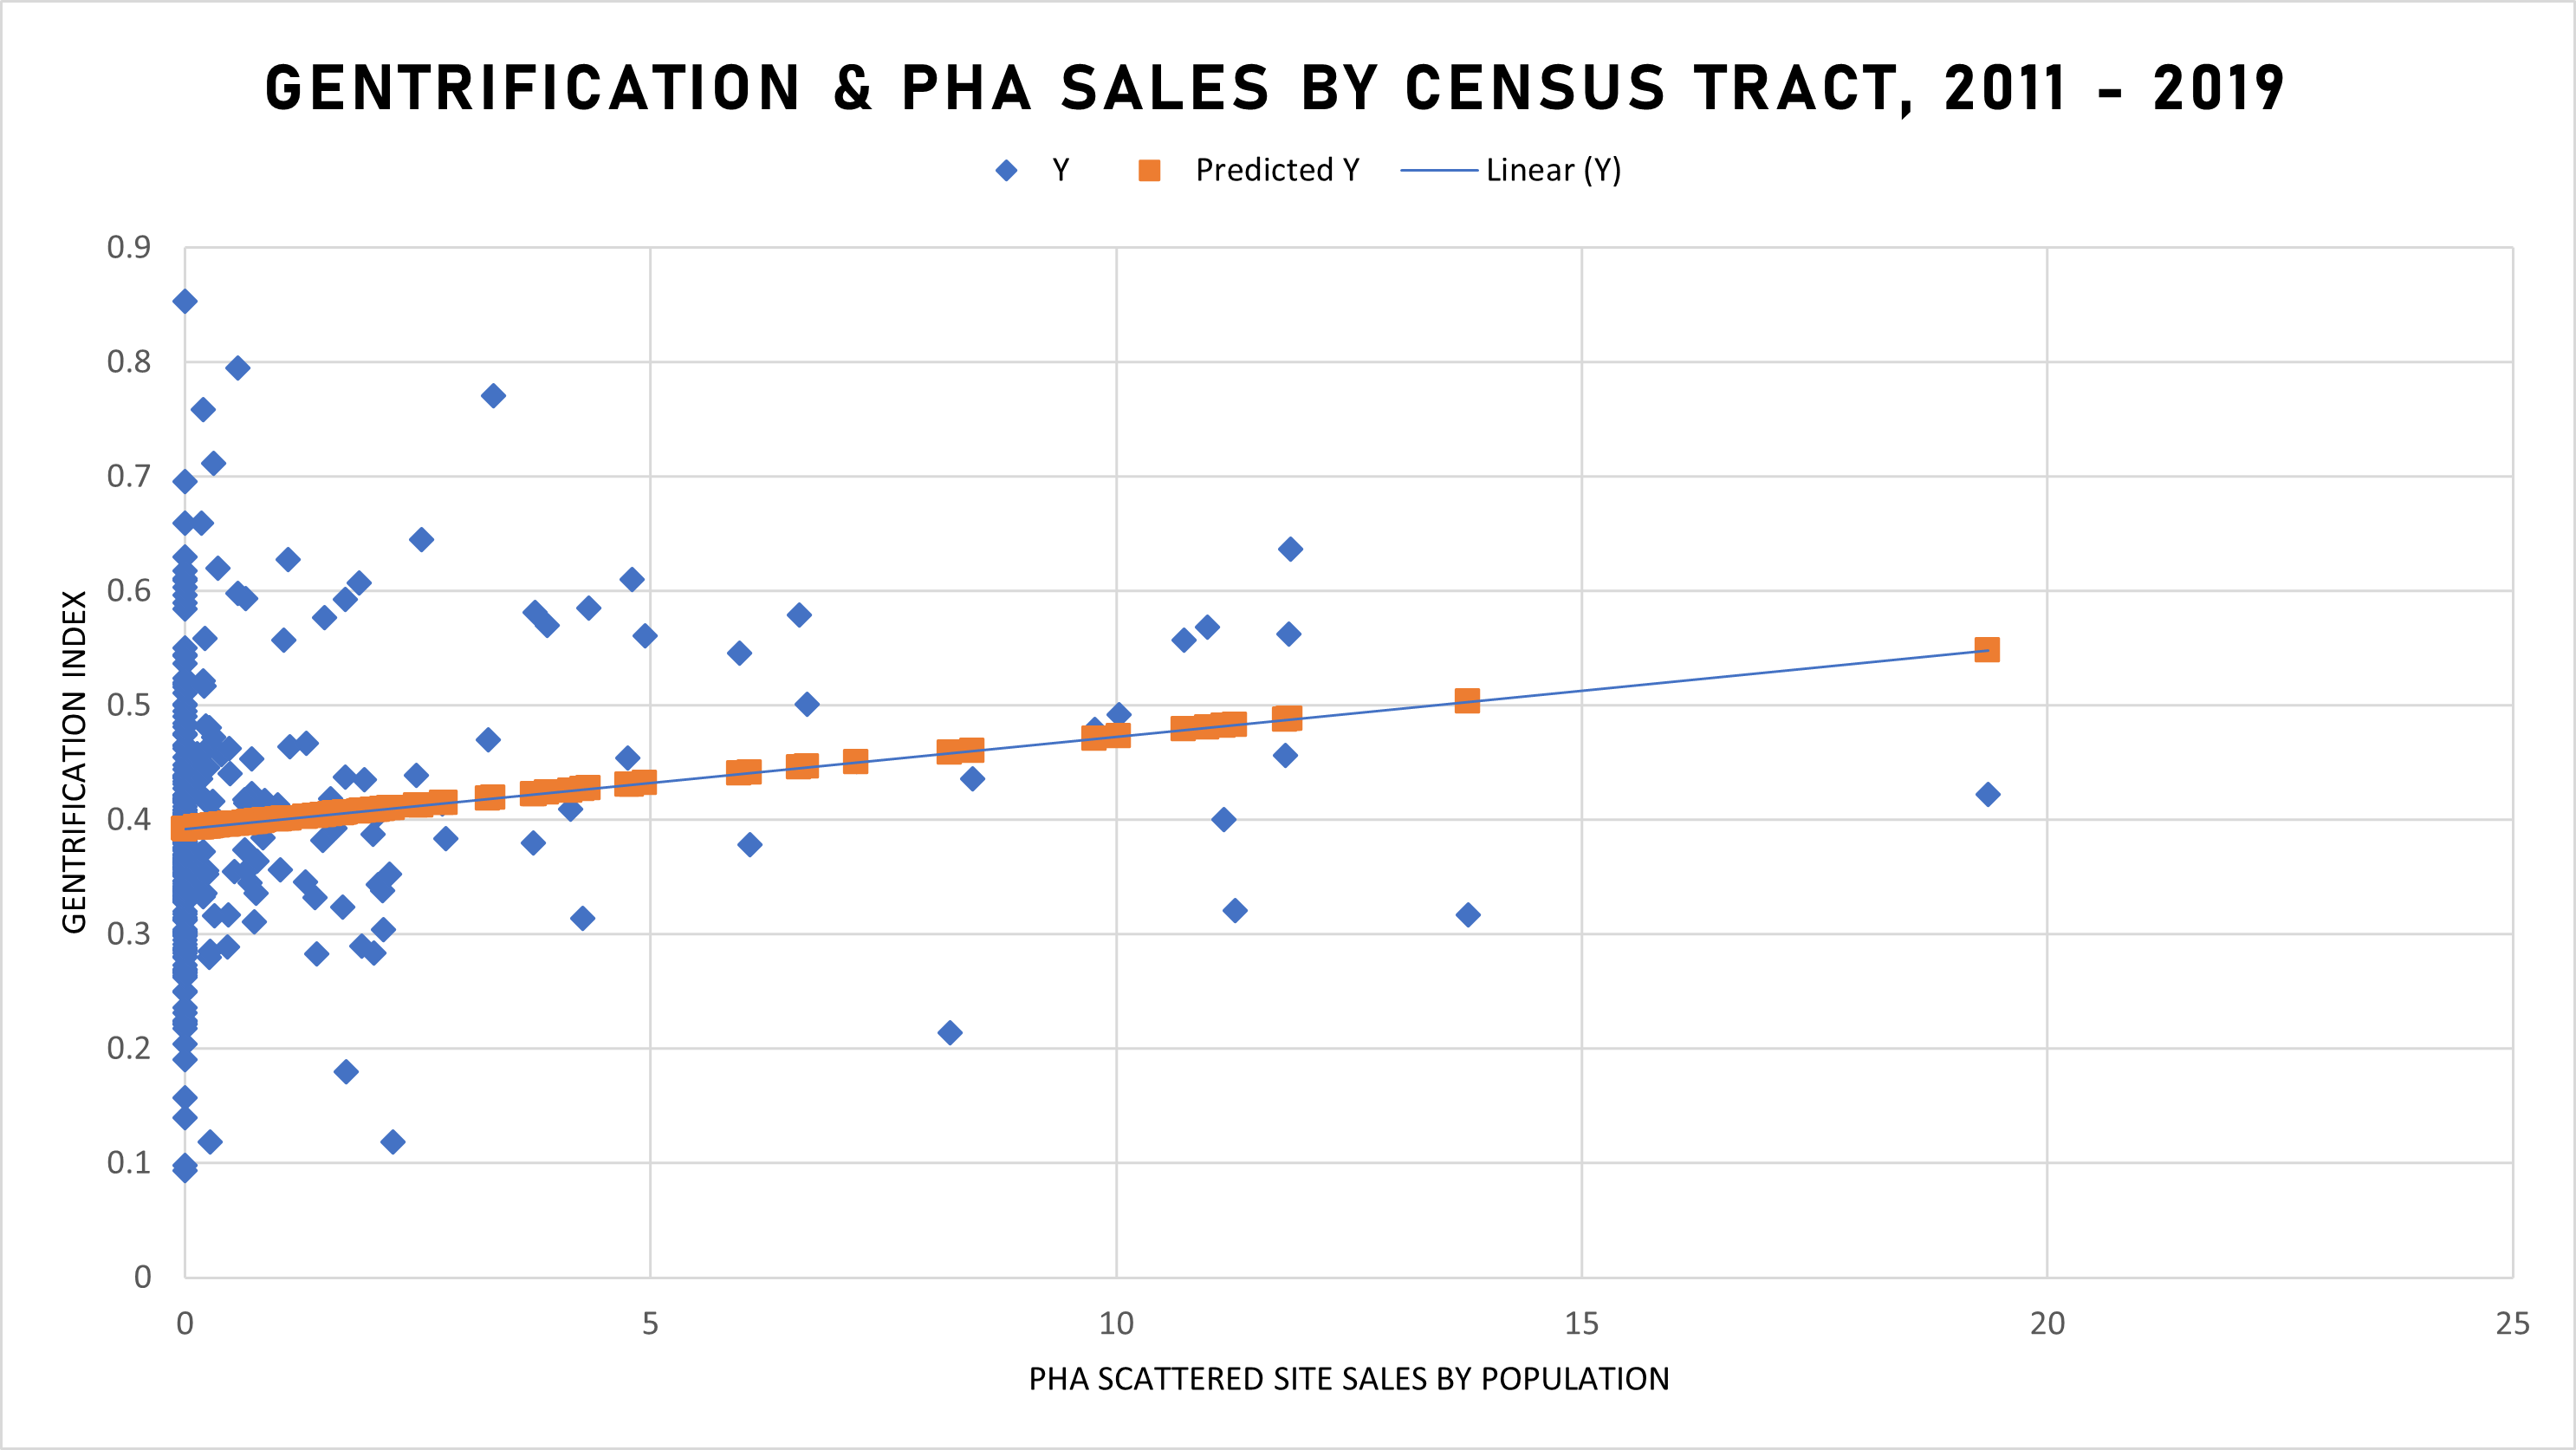
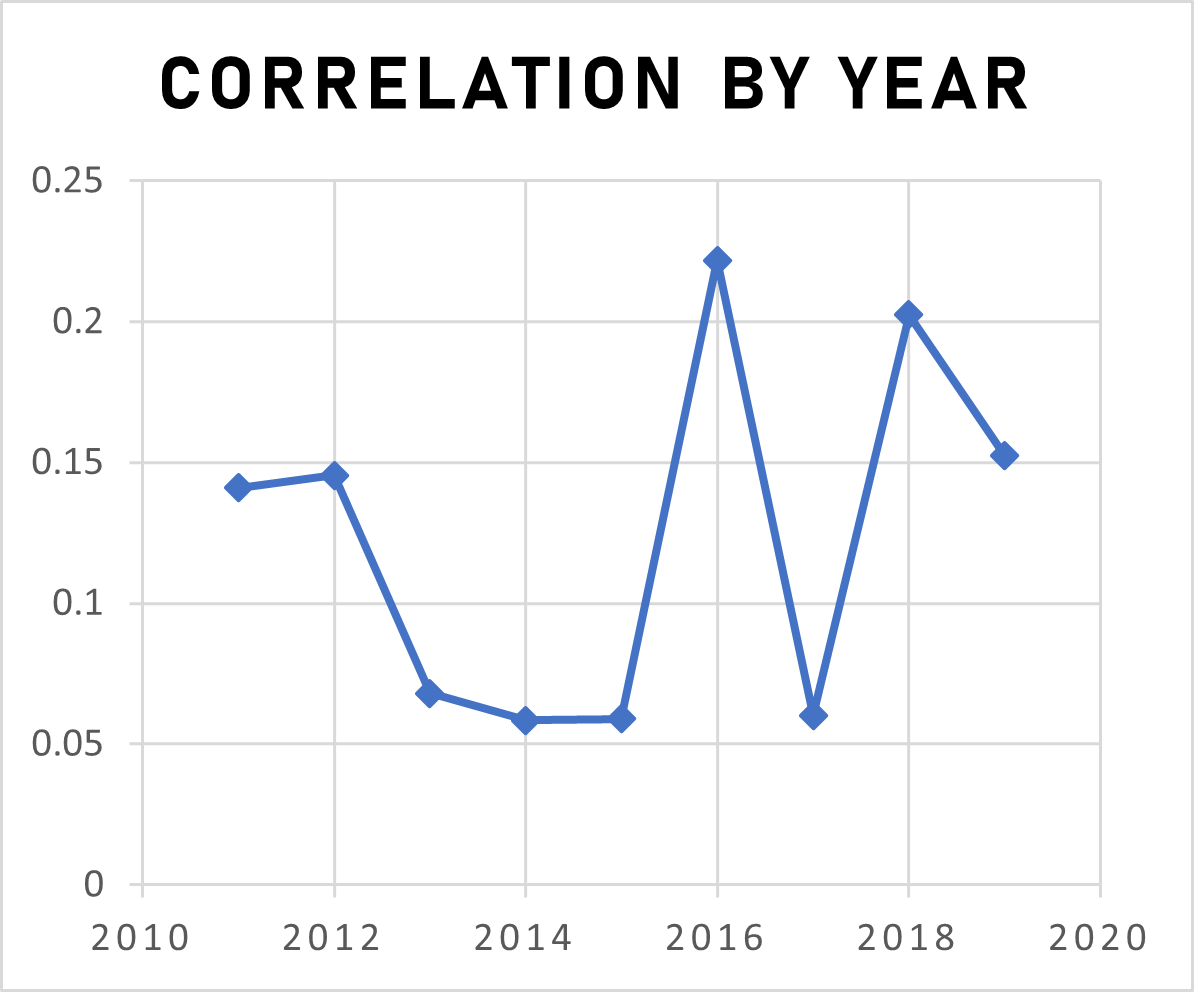
Figure 3: Line graph of annual sales of PHA’s scattered sites and their yearly correlation with the 2012-2019 gentrification model
Figure 4: Bar graph of annual sales of PHA’s scattered sites and their yearly correlation with the 2012-2019 gentrification model
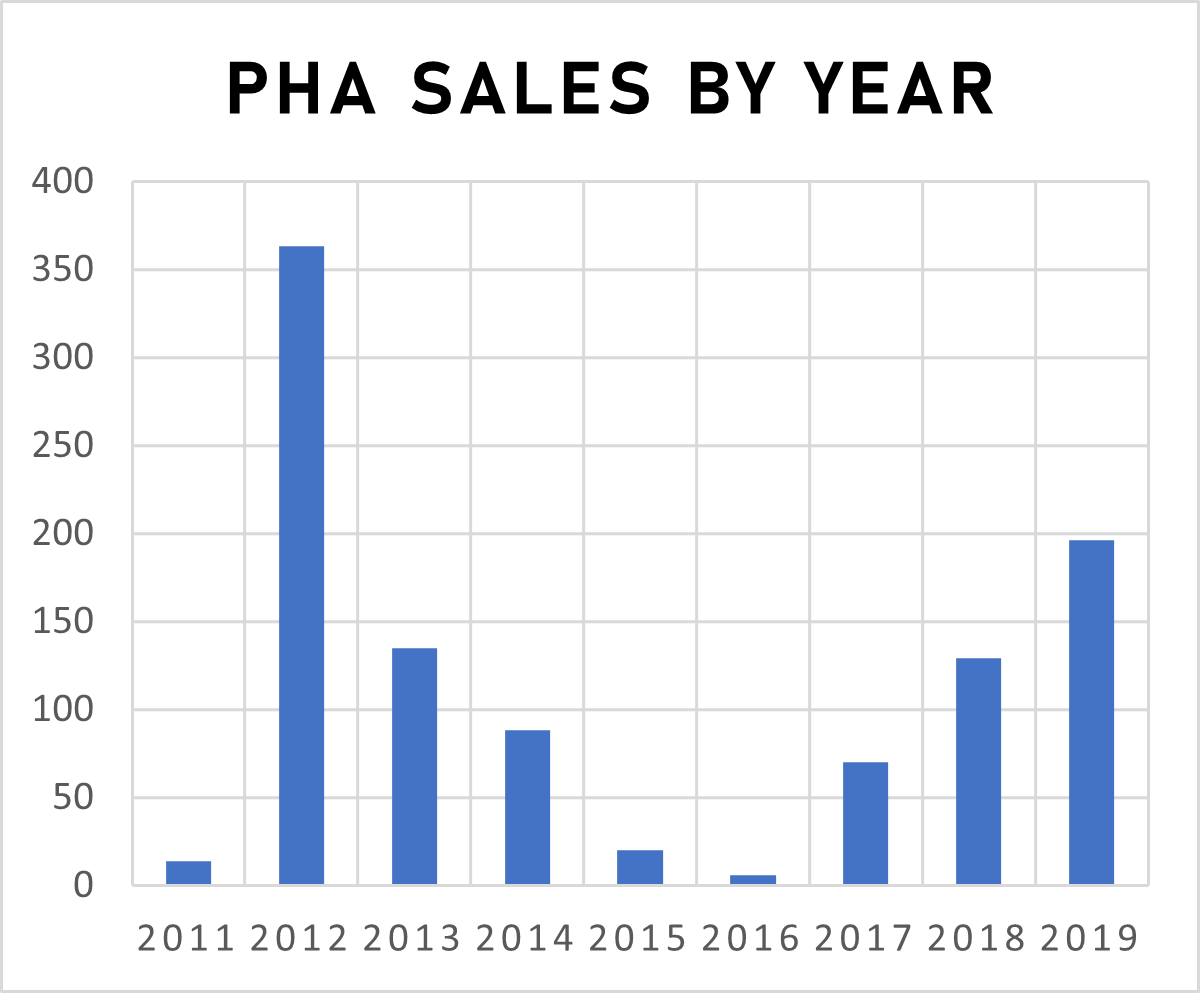
Figure 5: Model #2 without demographic component compared to proportional changes of racial demographics by census tract, 2012-2019
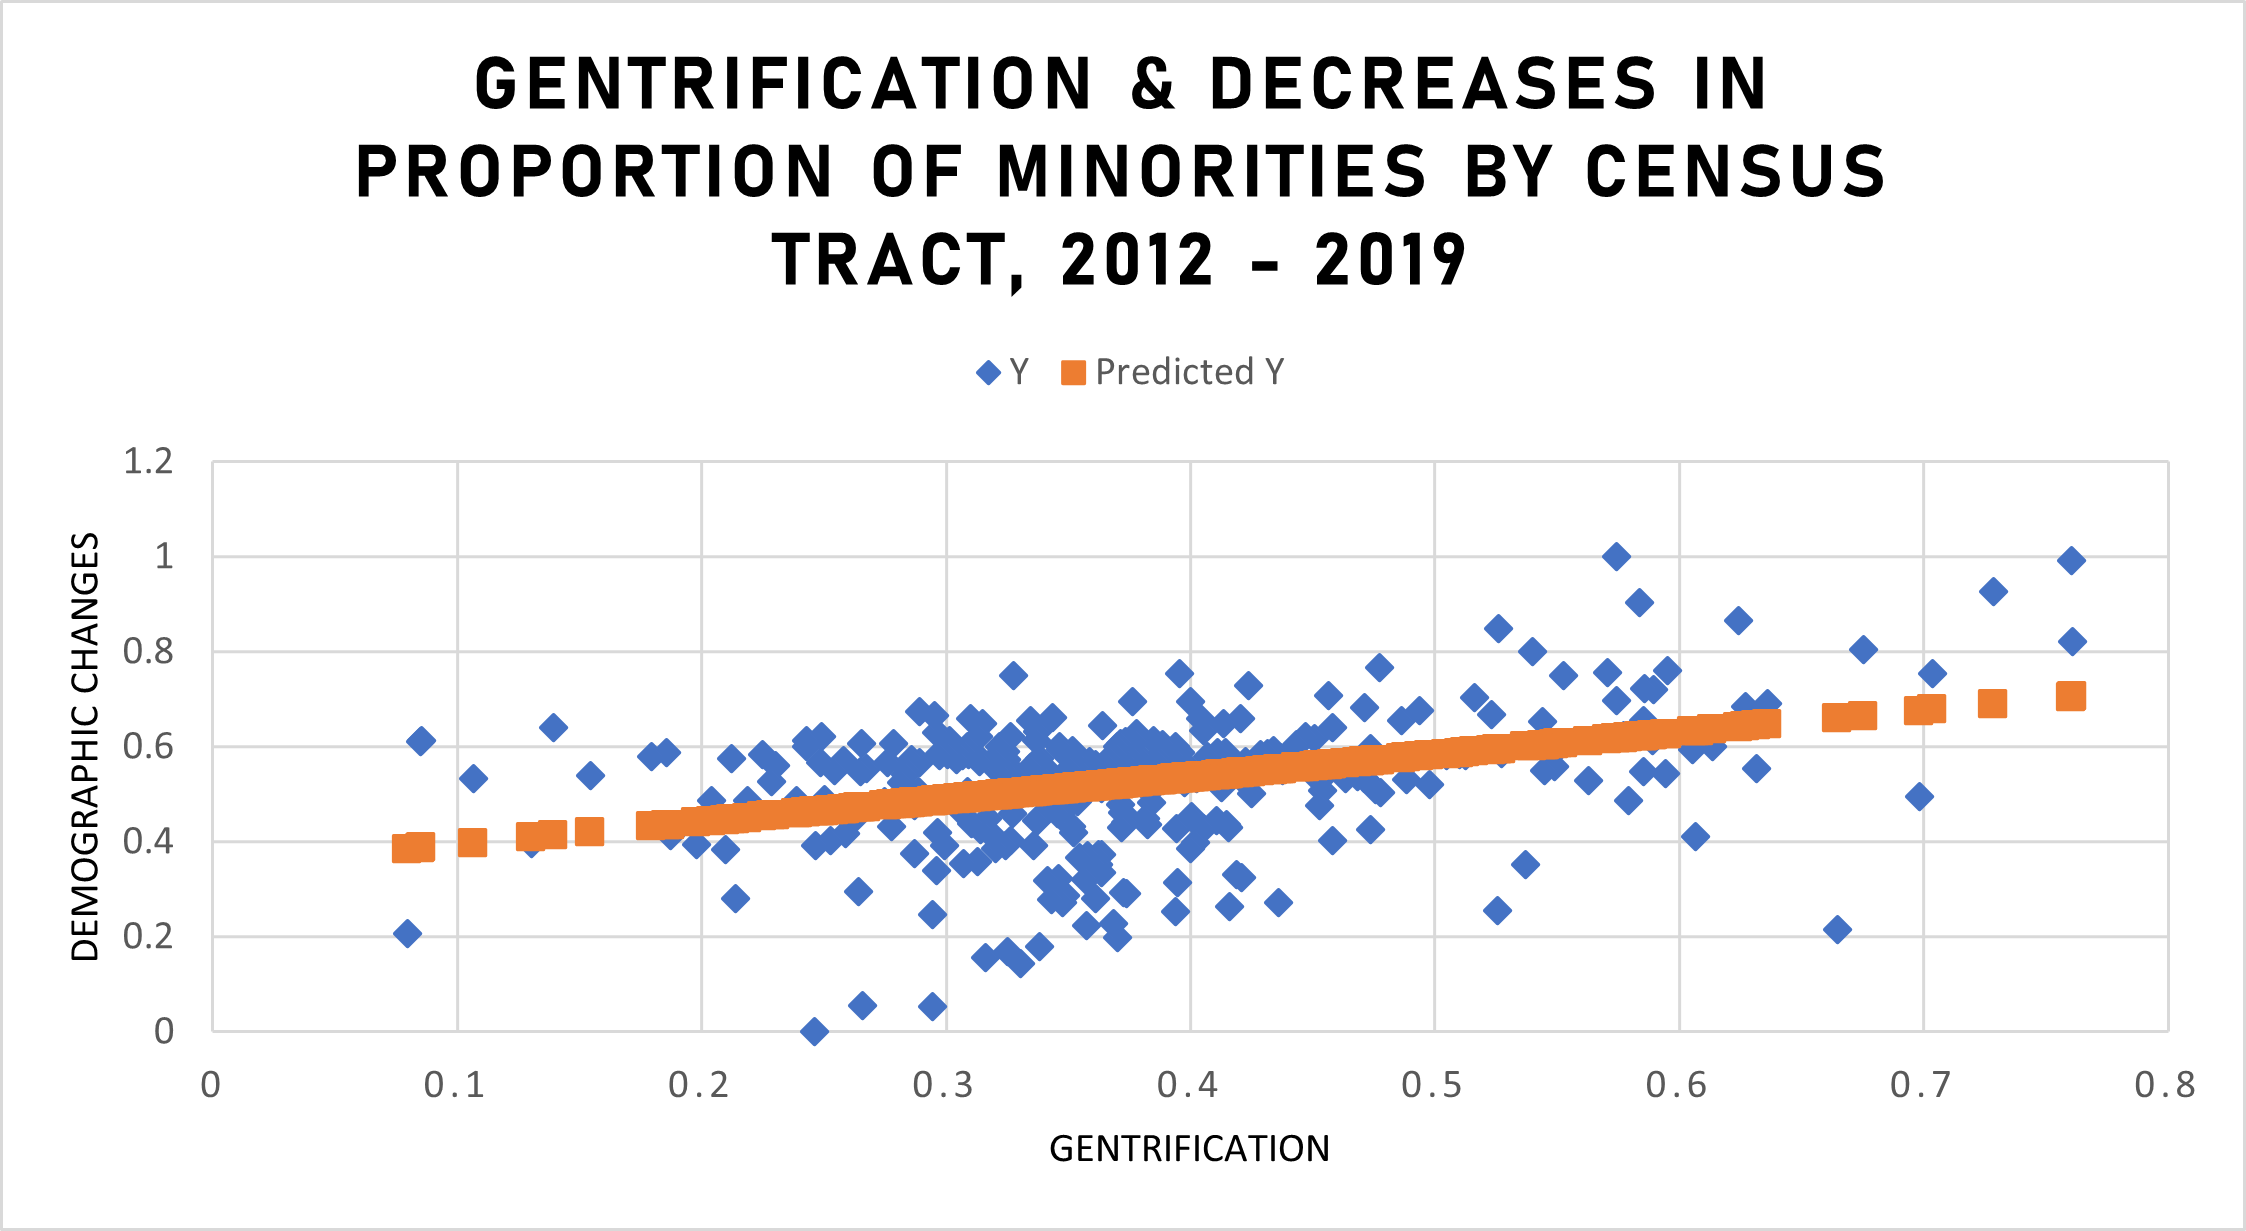
Figure 1a: Subset of Figure 1
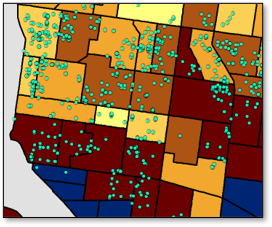
Whereas the findings of Model #1 indicate only a fairly weak correlation between PHA and gentrification, the map shown in Figure 1 may paint a different picture. The excerpt from the primary map, Figure 1a, shows most of the scattered sites sold by PHA between 2011 and 2019 and two major clusters of gentrifying neighborhoods in North Philadelphia, depicted in dark brown. This section of the map encapsulates the complexity of the weak correlative relationship between PHA and gentrification. The research team hopes the following explanation will resolve any confusion.
The correlation of 0.18 is relatively low for two reasons. First, many neighborhoods, such as Fishtown and South Philadelphia, gentrified without any influence from PHA. (Note that these neighborhoods are not pictured in the Figure 1a subsection of the map.) Too few PHA properties were sold in these areas of the city, so other factors are the sole cause of gentrification. Second, many PHA properties were sold in majority Black, low-income neighborhoods such as Strawberry Mansion, which have not shown any signs of gentrification. The census tracts on each side of the spectrum—those that have gentrified without PHA influence and others that showed no changes despite dozens of PHA sales—result in a weak correlation coefficient, make it difficult to prove that there is a strong link or a causal relationship between PHA’s scattered site sales and gentrification.
However, in the middle of the spectrum lie many communities, including Brewerytown, Spring Garden, Sharswood, and Cecil B. Moore, which all experienced significant levels of gentrification and saw many PHA property sales over the past decade. Many of these neighborhoods are the same communities that activists cite as evidence of PHA’s impact on gentrification. Although Model #1 indicates there is only a weak link between PHA and gentrification, anecdotal evidence from activists, media, and community interviews may tell a different story, as found in the interviews and case studies conducted by the research team. Some argue that simply the act of PHA selling low-income housing to real-estate developers for the construction of luxury apartments and university housing is enough to push more minorities out of an already-gentrifying neighborhood. If PHA’s property sales have any discernible impact on gentrification over this period, it is likely to be found in these neighborhoods.
Figure 6: Model #3 without demographic component compared to changes in raw minority population data by census tract, 2012-2019
Conclusion
The intangible nature of gentrification leads to many residents placing the blame on organizations such as PHA, even if they are not necessarily the sole driving factor behind inequitable community development. Twenty-first-century urban revitalization and the influx of capital and White suburbanites with college degrees and higher incomes naturally leads to development, which in and of itself is not problematic. What is troubling, is when the positive effects of neighborhood development only benefit certain populations or harm historically marginalized communities, via displacement or rapid demographic shifts. If an existing resident is not displaced outright but rather sees profound changes in the cultural fabric of their community, forcing them to go farther for goods and services, worship, or work, what is the likelihood that they remain or benefit from the development?
In conclusion, the research team has found that (1) PHA’s scattered site sales may have contributed to gentrification in some communities in Philadelphia, (2) minorities are being displaced as a result, and (3) PHA has a significant public relations crisis with the surrounding community. Although the research team understands PHA’s significant financial constraints, public perceptions of PHA as a profit-driven developer only contribute to growing community frustration and the Occupy movement against the agency. Given the outcome of the protests from Occupy PHA and other groups over the past year, many of the recommendations provided aim to give PHA the toolset to construct a more careful approach in improving the agency’s financial stability without harming underprivileged communities. PHA properties are commonplace across city neighborhoods, and as such, they are inextricably tied to the ability of any resident to live and thrive. In accordance with PHA’s 12 strategic priority areas of the Moving to Work Annual Plan, PHA’s number one priority is to “preserve and expand the supply of affordable housing available to Philadelphia’s residents with low-incomes,” (PHA 2020b). In other words, the sale of affordable housing units is in contention with the organization’s mission.
Divestment of scattered sites may better equip the agency to address their second strategic priority, to “achieve excellence in the provision of management and maintenance services,” but PHA must reflect on whether the Scattered Site Strategic Repositioning plan is in conflict with both their first and eleventh priority to “Ensure that PHA is a good neighbor and reliable community partner” (PHA, 2020b). The intricacies of how PHA meets its mission, along with the question of whether divestment can meet that mission at all, can only be answered by the agency itself. The research team hopes that PHA can take this body of work and the recommendations within into consideration as they continue to make strategic decisions that will undoubtedly shape the lives of Philadelphians under their care.